All Posts in "Uncategorized"


Upcoming $3 Trillion Spending Bill Set to Cause Copper Mining Boom
US Economic Advisers are pushing a massive spending package, with a giant infrastructure plan that should blast copper demand into orbit.
Under the moniker of “Build Back Better”, economic advisers for the current US administration are championing a sweeping $3 trillion package to boost the economy, beginning with a massive infrastructure plan.
Once news of the new planned US spending hit the market, demand for metals rose. There was one critical metal in particular that seriously took off hitting a nearly 10 year high… COPPER.[1]
We believe we’ve identified a company that’s perfectly positioned to capitalize on the days ahead, with a pair of enviable properties in a country about to see a major MINING BOOM.
Emerging copper & gold mining developer Ridgestone Mining Inc. (OTC:RIGMF, TSXV:RMI) is poised for a breakout in TWO of Mexico’s top producing mining districts—including the country’s top producing copper region, Sonora.
Mexico’s mining output has already rebounded above pre-pandemic levels, despite ongoing challenges presented by the global health crisis.[2]
But will it be enough?
There’s a SERIOUS global shortage of copper on the horizon—a gap projected to reach 10 million tons in the next decade.[3]
Goldman Sachs has warned of this historic shortage, stating: “the market now on the cusp of the tightest phase in what we expect to be the largest deficit in a decade.”[4]
Among the top producers of copper in the world is Peru, where their central bank just cut projections, due to COVID-related challenges to production.[5] Neighboring Chile is ramping up what it can, with BHP’s Spence Mine expected to hit peak production later this year.[6]
And don’t think that those massive supplies in Chile and Peru will be headed towards the USA to meet this infrastructure boom. Most of those large, copper-loaded ships are headed for Chinese ports.[7]
It’s beginning to look like North American demand will need to be met by North American supply.
Much more will be expected out of one of the largest copper mines in the world by reserve, Buenavista (aka Cananea) Mine.
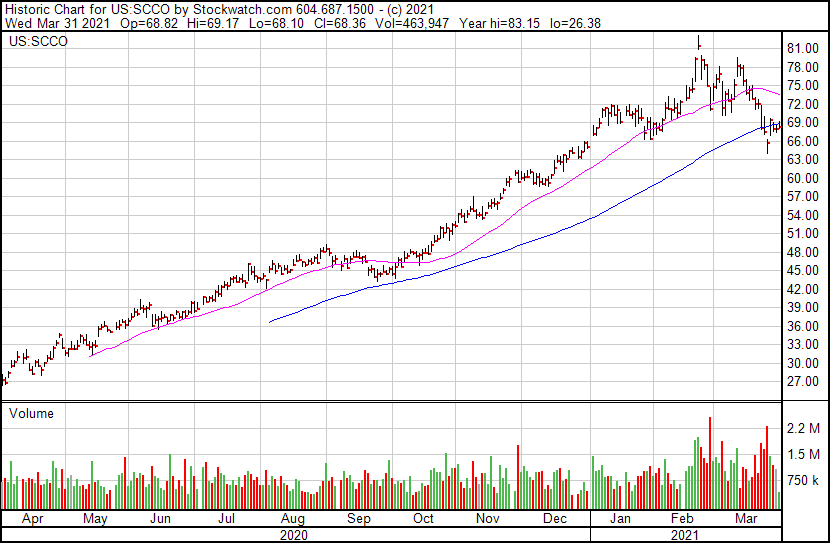
Currently the 5th largest copper mine in the world[8], the Buenavista Mine is located in Sonora State. It’s owned and operated by Group Mexico, which trades in the USA under the name Southern Copper Corporation (NYSE:SCCO).
It’s also one of the oldest open-pit mines in North America. The importance of the Buenavista Mine is heightened for Southern Copper, especially because the company recently had to cancel its Tia Maria copper project in southern Peru because of “anti-mining terrorism” in the area.[9]
So the focus back on Mexico appears to be even more warranted than before.
Among the Top 10 producing mines in Mexico, 6 are located within the mining districts of either Chihuahua or Sonora.
Ridgestone Mining Inc. (OTC:RIGMF, TSXV:RMI) has established its properties within both of those districts, they’re surrounded by bigger players that will (as will we) be paying very close attention to their developments in the months to come.
In 2021, Ridgestone Mining Inc. (OTC:RIGMF, TSXV:RMI) is looking to advance both its copper-gold Rebeico project and gold-silver Guadalupe y Calvo projects.
After successfully closing TWO over-subscribed private placements, raising $2.32 million earlier this year, Ridgestone Mining is well capitalized and good to go.
We expect BIG results from a still-very-small company, which is primed for a growth spurt in 2021…
5 Key Highlights Pointing at Ridgestone Mining as a Perfect Mining Opportunity in Mexico
- TWO high-grade mining projects located within Mexico’s prolific Sierra Madre gold belt
- Exploration-stage Rebeico copper-gold project in Sonora
- Resource-stage Guadalupe y Calvo gold-silver project in Chihuahua
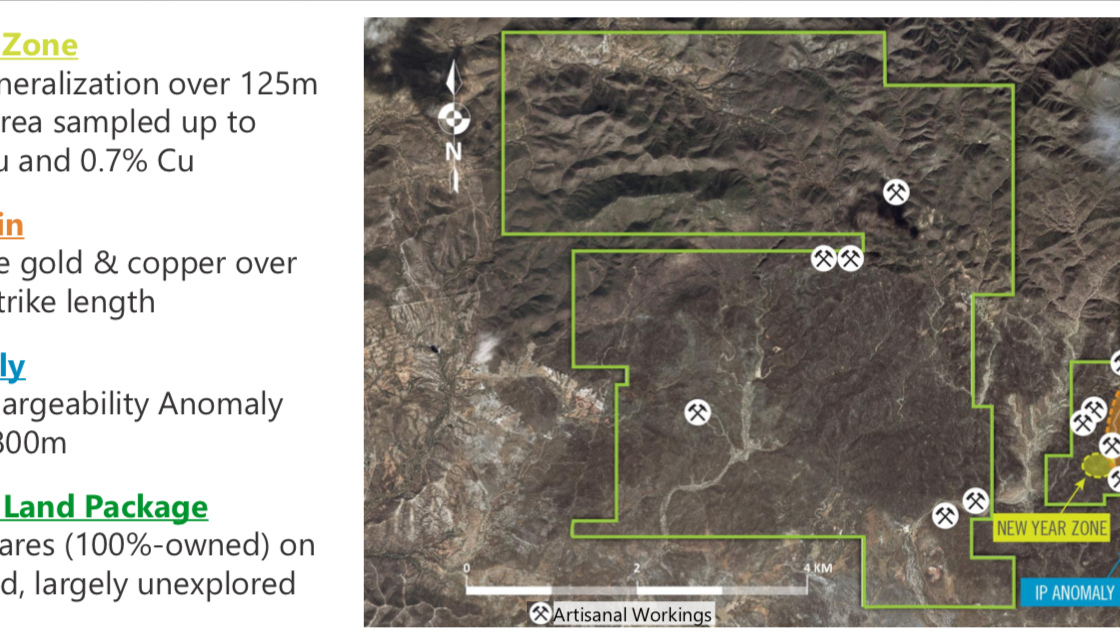
- Rebeico copper-gold project encompasses 3,459 hectares of private land with numerous artisanal gold and copper workings.
- Multiple mineralized zones identified: the Alaska Vein, the New Year Zone, the IP Anomaly, and a number of historic mines including the El Cobre copper mine.
- Past exploration highlights include:
- Alaska Vein
- 1.5 metres grading 1.2% copper plus 36.1 g/t gold
- 1.0 metre grading 5.95% copper plus 17.70 g/t gold
- New Year Zone
- 16.25 metres grading 1.79% copper plus 2.13 g/t gold
- Waste Dumps (from surface waste dumps/waste material from mining in the 1960s)
- 111 samples with an average grade of 0.8% copper plus 2.5 g/t gold
- El Cobre Mine (underground mine operated during the 1960s, samples taken from waste material)
- Samples grading over 2.4% copper
- IP Anomaly
- A potential copper-gold porphyry highlighted by a target spanning 1,400 metres by 800 metres
- Alaska Vein
- Guadalupe y Calvo (GyC) gold-silver project is located within a mining district with historic production of over 2 million ounces of gold and 28 million ounces of silver.
- Mineralization is characterized by low-sulfidation epithermal veins with multiple vein structures identified over a 3km strike.
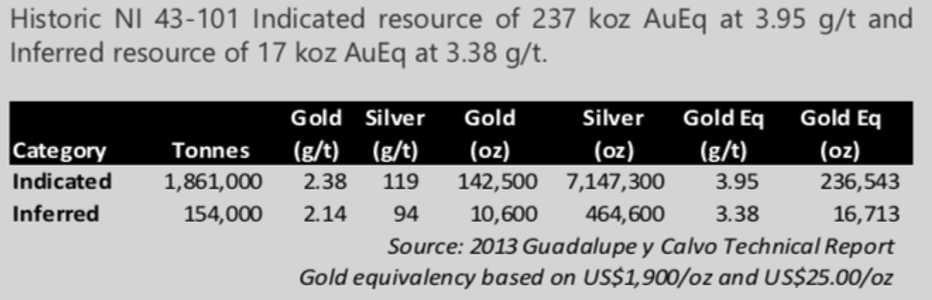
- GyC hosts a historical estimate NI 43-101 Indicated resource of 237,000 oz AuEq at a grade of 3.95 g/t AuEq and Inferred resource of 17,000 oz AuEq.
- Resource remains open for expansion along strike and at depth.
- Proven management team with a track record of discovery and monetization in Sonora State.
- Past successes include:
- Sale of the largest moly deposit in Mexico for $195 million
- Discovery of three gold deposits and one copper deposit which have become significant mines (two of which are still active in Sonora)
- Past successes include:
Copper-Gold Asset: Rebeico Project
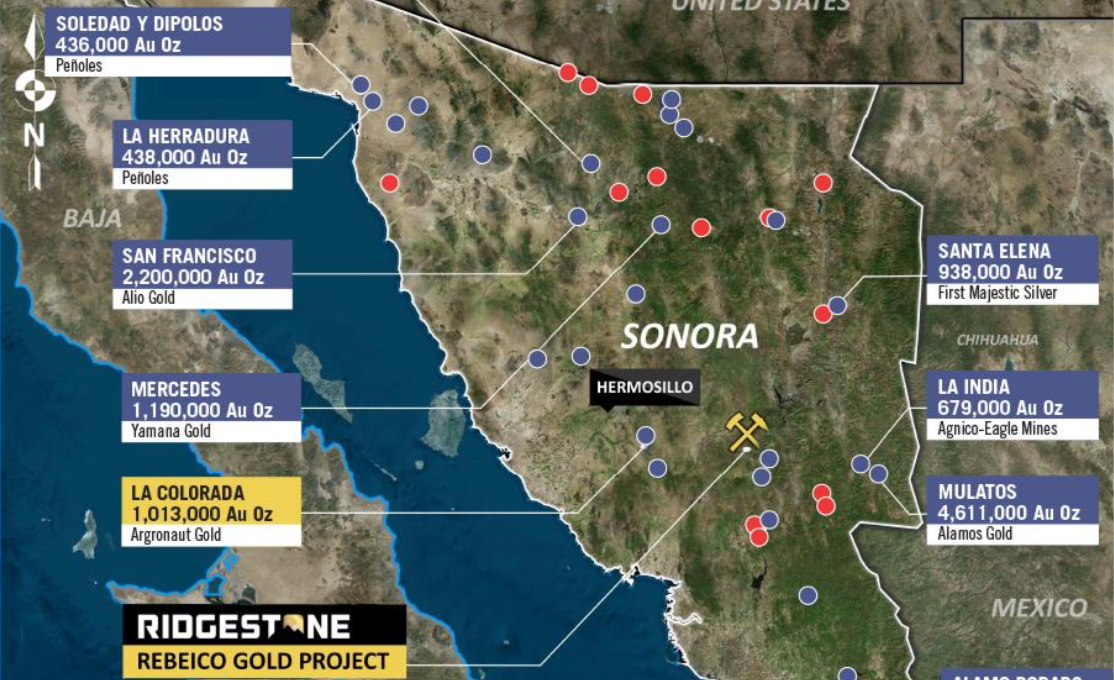
Rebeico is located 115km east of Hermosillo, a main operations support hub for the Sonora mining district.
Comprised of 16 concessions totaling 3,459 hectares on private land(no ejido), the Rebeico is accessible by highway and a network of all-weather roads.
Infrastructure is great, as there are grid electrical power lines within 6.5 km of the property.
Historic exploration on the property focused on the Alaska Vein and New Year Zone.
Alaska Vein drilling highlights included:
- 1.2% Cu and 36.1 g/t Au over 1.5 m
- 2.4% Cu and 8.3 g/t Au over 3.25 m
- Including 5.95% Cu and 17.7 g/t Au over 1 m
- 2.8% Cu and 8.7 g/t Au over 2m
New Year Zone drilling highlights includes:
- 1.79% Cu and 2.13 g/t Au over 16.25m
- 0.54% Cu over 29.15 m
On top of the two primary zones are additional prospective signs of copper potential. These include samples from historic mines, and waste by-products.
Waste Dumps (waste material from mining in the 1960’s) data includes:
- 111 samples with an average grade of 2.5 g/t gold plus 0.8% copper from surface waste dumps (waste material from mining in the 1960’s)
El Cobre Mine (historic mine that operated into the 1960s) data includes:
- Waste material grading over 2.4% copper
IP Anomaly:
- Potential copper-gold porphyry highlighted by a target spanning 1,400 metres by 800 metres
Case Study 1: Southern Copper’s Buenavista Mine
Roughly 125 miles separate RMI’s Rebeico Project and Southern Copper’s Buenavista mine, which are both along the same trend in the prolific Sonora Mining district.
The Buenavista Mine is the oldest operating copper mine in North America, dating back to 1899.
In 2019, the mine produced 965 million pounds (Mlbs) of copper, which accounted for approximately 44% of the company’s total production for that year. The mine also produces silver and molybdenum as by-products. The contained copper at the mine is estimated to be 22.1Mt.[10]
According to the CFO of Southern Copper Corp., Raul Jacob, the company wants to almost double output by 2028, and possibly become the world’s largest producer.[11]
Jacob stated: “If this [copper] price level holds, we should see announcements of new projects coming in the market.”
It’s important to note that in order for Southern Copper to get there, the company has stated it will look at acquisition opportunities that come along, with asset quality being a top priority.
Given that the Rebeico Project is in the same mining district, and comes with full control given the private ownership of the rights, this could potentially make Ridgestone Mining a serious candidate in the years to come, with a very healthy valuation due to a better price environment.
“We feel comfortable in Latin America and very comfortable and positive about copper,” Jacob added, in an interview with Mining.com.
Between March 2020 and March 2021, shares of Southern Copper Corporation (NYSE:SCCO) has seen its shares rise from $26.57 on March 24, 2020 to a high of $81.53 in February 2021—for a rise of +200% in one year.

Gold-Silver Asset: Guadalupe y Calvo (GyC) Project

Located in the town of Guadalupe y Calvo, in SW Chihuahua State (~300km south of Chihuahua City) with excellent road access and strong local infrastructure.
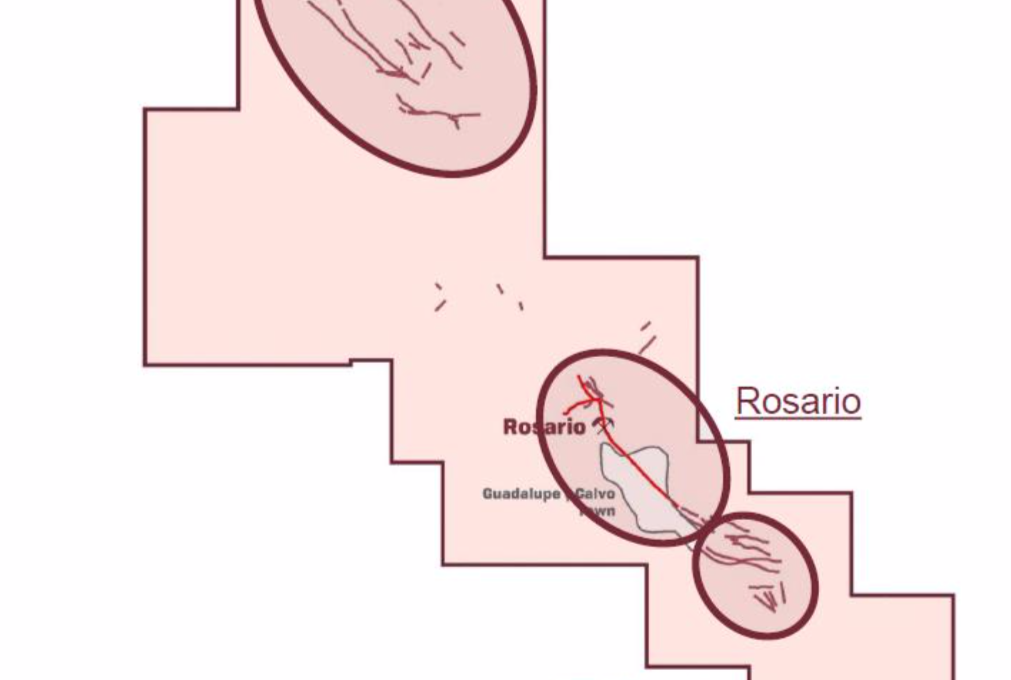
Comprised of 2,750 hectares of contiguous claims covering numerous historical workings, including the Rosario Mine.
Dating back to the 1930s, the Rosario Mine produced over 2 million ounces of gold, and 28 million ounces of silver.
Due to water-handling capabilities of the time, this historic production was limited… NOT because of the mineralization.
That means, that with today’s technology, it’s game on to get this project back up and running!
Management recognized this, as there are EXCELLENT near-term opportunities for resource growth in place, through additional drilling—Mineralization remains OPEN along strike and at depth.
Already there’s been significant exploration (over 200 drill holes) done in the past by companies that are now part of Goldcorp, Aurico Gold, and Endeavour Silver totaling over 50,000 metres.
Included within those drilling results were 4.1 g/t Au and 281 g/t Ag over 2.5 metres with NUMEROUS targets identified for follow-up exploration.
The Northwest striking Rosario fault complex is the project’s main structural feature, with a total width of the mineralized zone up to 80 metres.
Underground historic mining had widths of high-grade gold-silver mineralization up to 10 metres.
Case Study 2: Coeur Mining’s Palmajero Mine
Ridgestone Mining’s (OTC:RIGMF, TSXV:RMI) y Calvo Project is located near the city of the same name, which is just over 100 miles along trend to the southeast of the Palmajero Mine, owned and operated by Coeur Mining, Inc. (NYSE:CDE).
The property consists of a land position that totals approximately 27,233 hectares.
In 2020, the mine produced 6.3 million ounces of silver and 110,608 ounces of gold.
The Palmarejo silver-gold complex consists of:
- the Palmarejo mine and processing facility;
- the Guadalupe underground mine, located about 8 kilometers southeast of the Palmarejo mine;
- the Independencia underground mine, located approximately 800 meters northeast of the Guadalupe underground mine;
- other nearby deposits and exploration targets.
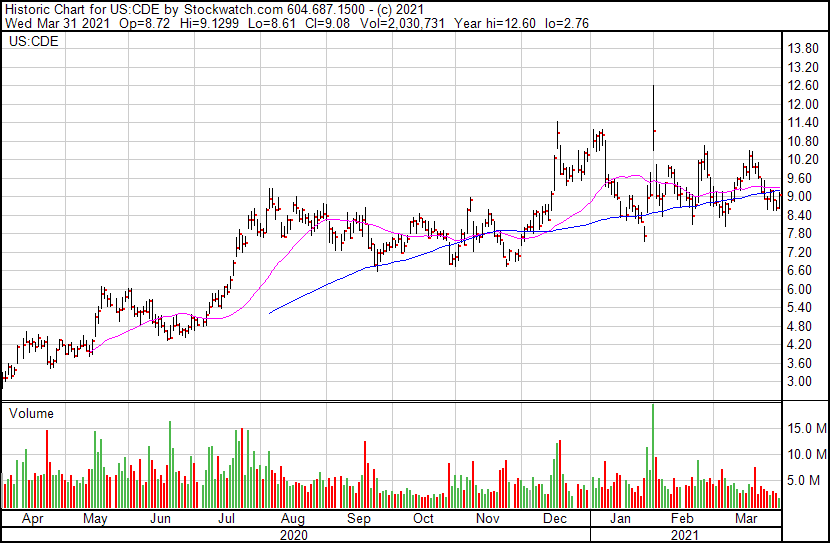
Between March 2020 and March 2021, shares of Coeur Mining, Inc. (NYSE:CDE) has seen its shares rise from $2.88 on March 18, 2020 to a high of $11.14 in February 2021—for a rise of 287% within one year.

Peer Groups in the Mexico Mining World
Ridgestone Mining Inc. (OTC:RIGMF, TSXV:RMI) is surrounded by successful mining operations in both the Chihuahua (GyC) and Sonora (Rebeico) regions.
Together, these regions are both within the Sierra Madre corridor, which has been known for its mineral endowment for a very long time.
This is one of the most mining friendly regions of the country.[12]
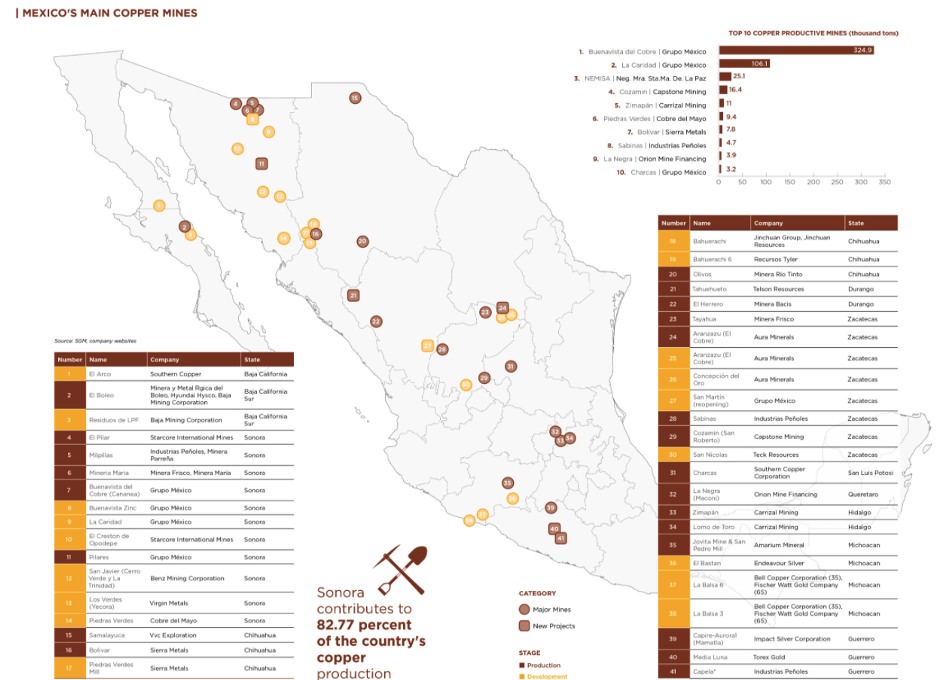
In particular, the Sonora region is Mexico’s most active mining region for both copper and gold[13]—Sonora contributes to 82.77% of the country’s copper production.[14]
The output and copper extracted from Sonora, in particular, is considered top notch quality, which is why the demand for this metal in the area is growing on a daily basis.[15]
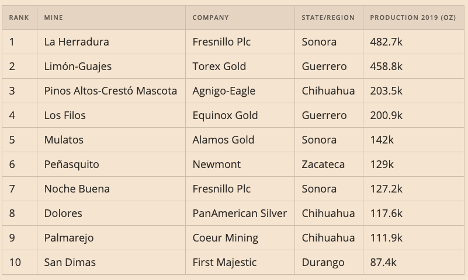
Beyond the copper production, according to Mexico´s Mining Chamber CAMIMEX, more than half (6) of Mexico´s ten largest operational gold mines are in those two regions.
| Company | Symbol | Share Price Today | Mkt Cap | State/Region |
| Ridgestone Mining Inc. | OTC:RIGMF TSXV:RMI | $0.165 | $12.44M | Chihuahua / Sonora |
| Fresnillo PLC | OTC:FNLPF | $13.25 | $9.63B | Sonora |
| Southern Copper | NYSE:SCCO | $67.48 | $52.17B | Sonora |
| Starcore International Mines | OTC:SHVLF TSX:SAM | $0.21 | $10.1M | Sonora |
| Minera Frisco | OTC:MSNFY | $0.49 | $1.67B | Sonora |
| Sierra Metals Inc. | NYSE:SMTS TSX:SMT | $3.06 | $500M | Chihuahua |
| Agnico Eagle Mines Limited | NYSE:AEM TSX:AEM | $60.46 | $14.66B | Chihuahua |
| Alamos Gold Inc. | NYSE:AGI TSX:AGI | $8.18 | $3.21B | Sonora |
| First Majestic Silver Corp. | NYSE:AG TSX:FR | $17 | $3.77B | Sonora/Durango |
| Argonaut Gold Inc. | OTC:ARNGF TSX:AR | $1.76 | $541.3M | Sonora |
* All price in USD
** Latest share price taken from Yahoo! Finance on April 13, 2021
Ridgestone Mining’s Management Team
Before it had even acquired its properties, perhaps the #1 asset that Ridgestone Mining had in place was its leadership team. Each member brings a proven track record of discovery and monetization, with expertise specific to Sonora State.
Past successes include the sale of the largest moly deposit in Mexico for $195 million, and the discovery of three gold deposits that have gone on to become significant mines—two of which are still active in Sonora to this day.
Among the talented team, here are some members we felt were necessary to highlight:
CEO & Director – Jonathan George
George is a geologist and mining entrepreneur with over 35 years of experience in exploration, development and financing. Previously President, CEO and co-founder of Creston Moly. Successfully raised $40 million in equity to acquire, develop, and de-risk the El Creston project before selling it to Mercator Minerals for $195 million. Other notable highlights include President and CEO of ESO Uranium, the predecessor to Alpha Minerals which was acquired by Fission Uranium for $185 million.
CFO & Director – Erwin Wong
Wong has over 26 years of experience having served in senior management and board level positions for numerous Chinese and Canadian based enterprises, both public and private, which were involved in various sectors including transport, real estate, mining, life sciences and investment banking. He had also founded a corporate advisory firm which assisted a number of companies with the complexities of initial public offerings, corporate governance and regulatory compliance in various jurisdictions. Erwin Wong is a Chartered Accountant and holds a Bachelor of Commerce from the University of British Columbia.
VP Exploration – Noris Del Bel Belluz
Belluz has over 35 years of experience in operations, exploration, geology and technical evaluations of both underground and open pit mines. Most recently, he was Operations Manager & Acting General Manager for Nevsun Resource’s Bisha mine, which was acquired for $1.8 billion by Zijin Mining Group Co. Previously, he was Manager of Mine Geology for Eldorado Gold’s China operations and with Freeport-McMoRan as Manager of Mine Geology at the Grasberg mine in Indonesia which included a key role in the discovery of the Kucing Liar skarn deposit. Belluz’s technical experience also includes holding senior roles with Stantec Engineering and Wardrop Engineering, overseeing various technical studies from NI 43-101 resource estimates to feasibility studies and detailed engineering. He holds a Bachelor of Science Degree in Geology from the University of Toronto and is a Qualified Person (QP) under NI 43-101.
Advisor – Dr. Andrew J. Ramcharan
Dr. Ramcharan has over 20 years’ experience in operations, project evaluation, mergers and acquisitions, corporate development, project finance and investor relations. Mr. Ramcharan has worked for a number of companies including IAMGOLD Corporation, Sprott Resources and Resource Capital Funds. He holds a Master’s and Ph.D Degree in Mining and Minerals Economics. Andrew is a Registered Member of The Society for Mining, Metallurgy and Exploration (SME) in USA, Licensed Professional Engineer in Ontario, Canada and Fellow of The Australasian Institute of Mining and Metallurgy. A graduate of the Colorado School of Mines, University of Leoben, and Harvard University’s Continuing Education program.
SOURCES:
[1] https://www.reuters.com/article/global-metals-idUSL1N2LA0K9
[2] https://www.bnamericas.com/en/news/mexico-mining-output-rebounds-to-pre-pandemic-levels
[3] https://news.metal.com/newscontent/101425386/Supply-falls-short-of-demand-A-global-shortage-of-10-million-tons-of-copper-in-the-next-decade/
[4] https://oilprice.com/Metals/Commodities/Goldman-Sachs-Historic-Copper-Shortage-Loom-As-Prices-Rocket.html
[5] https://www.mining.com/web/peru-central-bank-cuts-growth-forecast-for-2021-sees-tailwinds-from-rising-copper-price/
[6] https://cn.reuters.com/article/chile-copper-bhp-idCNL1N2KM001
[7] https://www.bloomberg.com/news/articles/2021-02-26/copper-crunch-is-set-to-ease-as-more-concentrate-heads-to-china
[8] https://www.kitco.com/news/2021-03-18/The-world-s-top-10-largest-copper-mines-in-2020-report.html
[9] http://www.laht.com/article.asp?CategoryId=14095&ArticleId=2381146
[10] https://www.nsenergybusiness.com/projects/buenavista-copper-mine-expansion/
[11] https://www.mining.com/web/copper-to-stay-tight-on-long-path-to-new-supply-top-miner-says/
[12] https://gambusinoprospector.com/mineral-resources-in-mexico/mining-regions/
[13] https://www.lexology.com/library/detail.aspx?g=e4db032c-8d2e-4360-a9c8-df86b0f6be59
[14] https://mexicobusiness.news/sites/default/files/2019-10/Map-Copper-mines_110-111.jpg
[15] https://electroheatinduction.com/copper-mined-mexico/
DISCLAIMER:
Nothing in this publication should be considered as personalized financial advice. We are not licensed under securities laws to address your particular financial situation. No communication by our employees to you should be deemed as personalized financial advice. Please consult a licensed financial advisor before making any investment decision. This is a paid advertisement and is neither an offer nor recommendation to buy or sell any security. We hold no investment licenses and are thus neither licensed nor qualified to provide investment advice. The content in this report or email is not provided to any individual with a view toward their individual circumstances. Equity Insider is a wholly-owned subsidiary of Market IQ Media Group, Inc. (“MIQ”). MIQ has been paid a fee for Ridgestone Mining Inc. advertising and digital media from the company directly (“the Company”). There may be 3rd parties who may have shares of Ridgestone Mining Inc., and may liquidate their shares which could have a negative effect on the price of the stock. This compensation constitutes a conflict of interest as to our ability to remain objective in our communication regarding the profiled company. Because of this conflict, individuals are strongly encouraged to not use this publication as the basis for any investment decision. The owner/operator of MIQ own shares of Ridgestone Mining Inc. which were purchased as a part of a private placement. MIQ will not buy or sell shares of Ridgestone Mining Inc. for a minimum of 72 hours from the publication date on this website March 31, 2021, but reserve the right to buy and sell, and will buy and sell shares of Ridgestone Mining Inc. at any time thereafter without any further notice. We also expect further compensation as an ongoing digital media effort to increase visibility for the company, no further notice will be given, but let this disclaimer serve as notice that all material disseminated by MIQ has been approved by the above mentioned company; this is a paid advertisement, and we own shares of the mentioned company that we will sell, and we also reserve the right to buy shares of the company in the open market, or through further private placements and/or investment vehicles.
While all information is believed to be reliable, it is not guaranteed by us to be accurate. Individuals should assume that all information contained in our newsletter is not trustworthy unless verified by their own independent research. Also, because events and circumstances frequently do not occur as expected, there will likely be differences between any predictions and actual results. Always consult a licensed investment professional before making any investment decision. Be extremely careful, investing in securities carries a high degree of risk; you may likely lose some or all of the investment.
Upcoming 3 Trillion Spending Bill Set To Cause Copper Mining Boom
Gold gets plenty of attention, but the outlook for base metals like copper is also positive in 2021. RBC Capital Markets analysts raised their 2021 average price estimate from $3.25 to $3.50 a pound due to higher consumption estimates. They expect copper consumption to be higher this year due to indicators that the economy is strengthening.
In a recent report, analyst Sam Crittenden and his team said the backdrop for copper remains positive this year, while low inventories support higher prices. However, they expect the supply response throughout the year to be gradual from both mines and scrap. These factors could moderate the copper price.
Copper equities also remain well-positioned in 2021, and the RBC analysts are starting to see multiple expansion as investors become more interested in the sector.
They note that North American base metals stocks have traded at an average EV/EBITDA multiple of 5.8 times over the last decade. On the other hand, the TSX index trades at a multiple of 9.2 times. Currently, North American base metals stocks are trading at a multiple of 6.9 times, while the TSX is at a multiple of 12 times.
We are following a few promising copper companies, for more information please enter your email in the box provided.
Thank you

Protected: The Smart Investor’s Way to Add PPE and Tech Solutions to Your Portfolio
Deregulation Is About To Make This Gaming Stock Go Crazy
Playgon Games Inc. (TSX.V:DEAL / OTC: PLGNF) is Targeting the Fastest Growing Segment of the Online Casino Gaming Market
Over the last year, we’ve seen not only the utter decimation of revenues and activity within the doors of land-based casinos, but also a mass exodus of players towards online gaming to fulfil their desires.
People are still playing their favourite casino games… except now they no longer need to be in the casino to do it.
According to Martin Calesund, CEO of the +$22B company Evolution Gaming:
“(The) online evolution has just started.”
According to recent industry metrics, the global online gambling market is expected to reach more than US$92.9 billion in 2023—nearly double the ~US$52.9 billion it is currently. [1]
Back in June of 2020 (when the global health crisis was still in its earlier stages), Calesund added to this thought, boldly stating:
“In the future to come, I think 50-70% of casino will be online.” [2]
The shift has been swift and very significant, as online gambling thrived and land-based casinos struggled mightily through 2020 to today. Mobile gaming made significant strides in 2020, notching $79.5 billion, and accounting for a whopping 71% of all app revenues on both the Google Play and Apple App Store combined. [3]
In Atlantic City, all but one casino (which we’ll get to in a second), lost significant revenue. The biggest dropoff came for Harrah’s, which declined 46.8% over the year. [4]
Resorts, Caesars, Tropicana, Borgata, Hard Rock, and Ocean… ALL saw their revenues drop by double-digit percentages.
The one casino that emerged from the bunch was Golden Nugget—it saw its revenues increase nearly 10% over their 2019 numbers.
How did Golden Nugget beat the odds?
The answer is right there in the full name of the stock is Golden Nugget Online Gaming (NASDAQ:GNOG).
That’s right… Golden Nugget is focused on online casino and sports betting.
It wasn’t just in Atlantic City that the company took wins. When they released their Q3 earnings in late October, they showed that their Net revenue was up 92% year-over-year (YoY) to $25.9 million, while Operating income was also increased 92% YoY to $8.2 million.
Since prior to the COVID-19 lockdowns taking full effect, GNOG stock has gone from a low of $9.26 per share to a high of $26.24 in late December—a rise of 183% in just over 9 months. Market researchers have pegged the global online gambling market to grow from $53.7 billion in 2019 to +$95 billion by the end of 2025 at a CAGR of 13.2%. [5]
The industry can no longer afford to deny that Evolution Gaming’s Martin Calesund is right.
The online evolution has begun!
We’ve identified the best equipped provider of a proprietary market-ready and device-agnostic platform that’s perfectly designed to facilitate the transition of these massive casinos into the online age…
One that’s succeeded in developing not only one of the fastest, most-convenient ways to play, but has done so with the World’s ONLY Live-Dealer mobile app gaming experience with LIVE video streaming of their dealers from a studio in Las Vegas.
Meet Playgon Games Inc. (TSX.V:DEAL / OTC: PLGNF) an innovator focused on developing digital content for the iGaming market, through a mobile-first philosophy with live dealer technology.

Platinum Profile: Playgon Games Inc. (TSX.V:DEAL / OTC: PLGNF)
Playgon provides a multi-tenant gateway that allows online operators the ability to offer their customers innovative iGaming software solutions.
What makes Playgon’s platform most unique for players is its design and feel.
CEO Darcy Krogh recently stated: “We are bringing a very unique mobile live dealer product to the market. We anticipate our business will scale quickly once we receive the final approvals to service our customers.”
Not only does the company provide the World’s ONLY Live Dealer mobile-app experience, but it does so vertically, meaning that players can comfortably play one-handed.
It’s also VERY fast. As a core feature of the design the software was geared towards speed as an integral part of the extremely popular table games of baccarat, roulette and blackjack (NOTE: More on the game of baccarat below).
Through the Playgon platform, hands can be played extremely fast, with up to 8 tables playing at once on one screen.
AN ALLURING BUSINESS MODEL
Playgon’s current software platform involves Live Dealer Casino and E-Table games which through a seamless integration at the operator level allows customer access without having to share or compromise any sensitive customer data.
And the business model is ideal for garnering more and more clients to onboard the software.
This turnkey solution is FREE to incorporate into an established casino’s offerings. Playgon has very wisely made this available, with the upside coming through revenue percentages of player loss on every game played.
As players bounce between casino operators, they are still playing re-skinned Playgon games. By providing the software, Playgon spends next to nothing on marketing, while capitalizing on the upside from newly acquired players.
As a true business to business (B2B) digital content provider, Playgon’s products are ideal turn-key solutions for online casinos, sportsbook operators, land-based operators, media groups, and big database companies.
Its cutting-edge technology and operational best practices make Playgon the best possible partner for online casinos looking to the future. Playgon also employs a global strategy, uniquely positioning it to take advantage of the sizable market in Europe and Asia.
BOOSTING BACCARAT’S BANKROLL POTENTIAL

While the popularity of baccarat continues to grow in the west, it’s common knowledge within the industry that James Bond’s favourite card game is the most profitable casino card game on the planet. This is because in Asian markets, players mostly stay away from slot machines, while VIP baccarat accounts for roughly 70% of casino revenue shares, followed by mass-market baccarat. [6]
Today’s casino gaming market is steadily growing in Asia, with industry experts in the region estimating the Asian live casino market to be 10x the size of its European counterpart.
Playgon’s team knows this, and has wisely designed itself towards this trend— and has developed a way to unlock baccarat’s enormous potential—having the game played online.
Why? Because in a traditional casino setting, games such as Baccarat and Roulette are not scalable because they can only serve a fixed number of players at a time.
In contrast, the majority of games can support a limitless number of players betting at the same time, while bearing none of the other overhead costs a traditional casino would have to bear (i.e. free drinks to players, casino maintenance expense, etc.).
Under Playgon’s business model, the Live Dealer salary becomes a fixed cost which can be leveraged across hundreds of potential concurrent players instead of just a few players at a traditional casino table.
Given the speed at which hands of baccarat are played is already a significant bonus to casino profitability. Now when the hands are dealt, bets are handled, payouts are paid and all other actions are done electronically. It’s fast, smooth, and profitable.
With their ability to maintain a whopping 8 tables on one screen at the same time, brick-and-mortar casinos just can’t compete with the speed of play of the Playgon Games Inc. (TSX.V:DEAL / OTC: PLGNF) baccarat experience.
And baccarat is a game that’s VERY familiar to those within the company. Playgon Interactive Founder, Guido Ganschow wrote the first live dealer software used in Asia—leading software sales to over 200 different casinos, many of which still use the software today.
LIVE DEALER GAMING—LIVE FROM VEGASTM!

Playgon Games Inc. (TSX.V:DEAL / OTC: PLGNF) is looking to capitalize on the Live Dealer Casino market, which represented 30% of the total online casino gaming market in 2019—or $5 billion. [7]
The company’sscalability results in a far more attractive business model than any land-based casino can offer. By integrating augmented reality, tactically adjusting bonuses and payouts, and optimizing player- dealer communication, Playgon’s offering is more immersive than the experience at a brick & mortar casino.
The platform’s Live Casino offering brings the brick & mortar casino experience to a user’s phone, computer, or other streaming device. Contrary to typical digital casino games which feature no physical human interaction, Live Casino is 100% focused on seamless interaction between gamblers playing from all over the world.
Live Casino is the fastest growing segment within online casino, with an annual growth rate of 32% between 2014 and 2018 and is expected to reach $8 billion by 2023. [8]
Mobile online gaming continues to be a key factor in the development of the global iGaming market. Currently, over 70% of Live Dealer casino revenues stem from mobile devices.
Playgon’s Live Dealers are streamed live from a studio in Las Vegas—click here for an example video
Players can interact in real time with the dealers and other players in real time 24 hours a day, 7 days a week—all complimented by augmented reality that further enhances the experience.
And, due to the overwhelmingly positive feedback from Operators, Playgon has already increased the size of their Live from Vegas studio and doubled their table capacity.
Playgon is taking live-dealer casino games to the next level, bringing cutting-edge handheld features and functionality to the mobile generation of gambling enthusiasts who have long been demanding a world-class gambling experience on their phone.
THE PLAYGON ADVANTAGE
Playgon has centralized its offerings to be as convenient and comfortable as possible to play.

Its advantages are unique, including
One Touch + One handed play.
Currently over 70% of Live Dealer casino revenues stem from mobile devices. Based on analytics provided by ScientiaMobile.com [9], Playgon has determined its focus solely on a Portrait-first orientation of its platforms.
Mobile users predominantly prefer this orientation by significant numbers:
- iOS = 97%
- Android = 89%
In fact, according to ScientiaMobile, only 22% of people flip their smartphone from portrait to landscape orientation.
HD Streaming
The Playgon experience is driven by High Definition content from a streaming studio Live from Las Vegas—delivering the user a truly live feel and presence.
Mobile First Approach
Most legacy technology is developed for desktop and not for mobile, making it inefficient for user interface (UI) and user experience (UX).
Playgon’s platform has been designed with a mobile first approach in mind. This focus enhances player UI and UX.
But despite having portrait-orientated mobile as its flagship offering, Playgon’s platforms entail Progressive Web App (PWA) technology, that’s device agnostic, and designed to handle every type of user, every browser, and play on every device.
It’s this portability that works to Playgon’s advantage, in particular when it comes to the potential for white labeling the service to work in conjunction with competitors; Operators don’t need to displace other providers to integrate Playgon’s Live Dealer games.
Playgon offers proprietary technology, which is cloud based and built for robustness, scalability, speed of play, to derive the maximum bets per hour that equates to more revenue. Ultimately, the platform and games are designed to attract the most sought-after player; the discerning, higher-value, returning player to maximize life time value.
Management & Board with Exceptional Experience
Darcy Krogh – President, Chief Executive Officer & Director of Playgon Games Inc
Involved the space for 21 years, Krogh began in iGaming by co-founding Chartwell Technology in 1999, a publicly traded technology company specializing in the development of games, gaming systems, and entertainment content focused in Europe. He served as a Director and was a key member of the management team, staying on after the company was sold to Amaya in 2011 for CAD$25 million. He served as VP Business Development with Amaya until July 2015 where he assisted with the divestiture of its B2B asset portfolio for $150m to Nyx Gaming Group. In April 2016 he exited NYX Gaming to start up a new venture, Playgon Games Inc.
Guido Ganschow – President & Director of Playgon Interactive
Playgon Interactive Founder Ganschow has created real-time Live-Dealer platforms for 12+ years, having served as Co-Founder and Creative Director for a Macau Casino Consortium, and successfully creating and establishing Live Dealer platform businesses in Asia and Europe between 2008 and 2014. In 2016 he started Playgon Interactive with a mandate to develop a next generation live dealer product for real money and social applications. Over his career, Ganschow has executed commercial partnerships, sales, and integration of the Live-Dealer solutions with major global gaming brands including Ho Gaming Group, Chartwell Technology and Amaya Gaming Group.
James Penturn – Executive Chairman of the Board
Penturn has decades of experience providing strategic advice and leadership to management teams of knowledge based businesses to successfully market and sell their services, to structure and syndicate investments, and to raise equity and debt instruments. He is the President of SpectraLegal Limited in the United Kingdom, a specialist provider of funding solutions for law firms. He is also a member of the strategic advisory committee of Generation Three Family Partners, an international multifamily office that he co-founded. He has been a director of several Canadian publicly listed companies where he sat on executive, audit, governance and compensation committees. Penturn has over 30 years’ experience in merchant banking, real property and strategic advisory services as both a principal and agent.
Steve Baker – Chief Operating Officer
Baker is the former VP Operations for Shaw Communications and has been involved in a number of major growth products including video streaming and home entertainment. He has helped the company grow sales revenue from $300 million to $2.8 billion. He’s also overseen new product rollouts and M&A activities.
7 Key Highlights to Remember for Playgon Games Inc. (TSX.V:DEAL / OTC: PLGNF)
- Fully Developed Platform ready to launch with multiple tier-1 operators
- Mobile Driven Strategy drastically improves user experience relative to competitors’ desktop-first approach
- Diversified Risk through leveraging technology across real money and social gaming markets
- Live Dealer is the fastest-growing vertical within the online casino business
- Global Industry Growth in iGaming has been projected to increase at a yearly CAGR between 10-15%
- Experienced Management team in technology and iGaming industries
- Industry Convergence terrestrial gaming industry’s movement to digital has been super-charged with the recent global health crisis.
[1] https://www.msn.com/en-us/money/topstocks/golden-nugget-online-gaming-stock-may-see-2420-before-2440/ar-BB1d0pEu
[2] https://www.gamblinginsider.com/news/9366/evolution-gaming-ceo-50-70-of-casino-revenue-will-be-online-in-the-future
[3] https://www.tweaktown.com/news/77100/mobile-gaming-made-79-5-billion-in-2020-71-of-total-app-revenues/index.html
[4] https://journalstar.com/news/national/a-record-year-for-nj-sports-betting-casinos-not-so-much/article_498a2a09-3e72-53ae-9a39-931c99dcc9ca.html
[5] https://www.globenewswire.com/news-release/2020/04/13/2015187/0/en/The-Global-Online-Gambling-Market-is-expected-to-grow-from-USD-53-686-56-Million-in-2019-to-USD-95-023-13-Million-by-the-end-of-2025-at-a-Compound-Annual-Growth-Rate-CAGR-of-9-98.html
[6] https://www.quora.com/Which-game-does-a-casino-generate-the-most-revenue-from-in-terms-of-quarterly-or-annual-revenue-Im-not-asking-about-odds-per-game-I-have-heard-the-answer-is-slots?share=1
[7] Source: H2 Gaming Consultants (https://h2gc.com)
[8] Source: H2 Gaming Consultants (https://h2gc.com)
[9] https://www.scientiamobile.com/
DISCLAIMER:
Nothing in this publication should be considered as personalized financial advice. We are not licensed under securities laws to address your particular financial situation. No communication by our employees to you should be deemed as personalized financial advice. Please consult a licensed financial advisor before making any investment decision. This is a paid advertisement and is neither an offer nor recommendation to buy or sell any security. We hold no investment licenses and are thus neither licensed nor qualified to provide investment advice. The content in this report or email is not provided to any individual with a view toward their individual circumstances. Equity Insider is a wholly-owned subsidiary of Market IQ Media Group, Inc. (“MIQ”). MIQ has been paid a fee for Playgon Games Inc. advertising and digital media from the company directly. There may be 3rd parties who may have shares of Playgon Games Inc., and may liquidate their shares which could have a negative effect on the price of the stock. This compensation constitutes a conflict of interest as to our ability to remain objective in our communication regarding the profiled company. Because of this conflict, individuals are strongly encouraged to not use this publication as the basis for any investment decision. The owner/operator of MIQ own shares of Playgon Games Inc. which were purchased in the open market. MIQ will not buy or sell shares of Playgon Games Inc. for a minimum of 72 hours from the publication date on this website February 5, 2021, but reserve the right to buy and sell, and will buy and sell shares of Playgon Games Inc. at any time thereafter without any further notice. We also expect further compensation as an ongoing digital media effort to increase visibility for the company, no further notice will be given, but let this disclaimer serve as notice that all material disseminated by MIQ has been approved by the above mentioned company; this is a paid advertisement, and we own shares of the mentioned company that we will sell commencing immediately, and we also reserve the right to buy shares of the company in the open market, or through private placements and/or other investment vehicles. While all information is believed to be reliable, it is not guaranteed by us to be accurate. Individuals should assume that all information contained in our newsletter is not trustworthy unless verified by their own independent research. Also, because events and circumstances frequently do not occur as expected, there will likely be differences between any predictions and actual results. Always consult a licensed investment professional before making any investment decision. Be extremely careful, investing in securities carries a high degree of risk; you may likely lose some or all of the investment.
Protected: This Under-The-Radar Biotech Stock’s Latest Move Could Be 2021’s Best Play
Red-Hot Battery Technology Space Poised for Great Disruption with New AI-Based Tech
The global battery market size was valued at USD 108.4 billion in 2019 and is expected to grow at a compound annual growth rate (CAGR) of 14.1% from 2020 to 2027. The market growth is attributed to high demand from the automotive application. The automotive application includes rechargeable batteries used in non-rechargeable batteries and electric vehicles. The increasing popularity of consumer electronics on a global scale is projected to result in the usage of the lithium-ion battery as a product type over the forecast period. High demand for portable electronics, including LCD displays, smartphones, tablets, and wearable devices such as fitness bands, is boosting the market growth. The market is expected to observe substantial growth on account of technological advancements in terms of enhanced efficiency, cost-effectiveness, and product innovation. Strict emission norms by the government authorities of developed countries, such as the United States and the United Kingdom, coupled with growing attention towards fuel efficiency, are expected to drive battery demand.
.
")
The U.S. battery market size was valued at USD 10.49 billion in 2019. The U.S. government has been cheering stakeholders for both renewable industry and Electric Vehicles (EVs), resulting in an improved demand for battery energy storage systems (BESS), mainly led by Li-ion batteries. The adoption of EVs is rising at a high rate across the country. The U.S. is one of the leading countries in global electric vehicle sales, along with other countries such as Canada, which has already begun transforming its transportation infrastructure for electric vehicles.
Decreasing fossil fuel reserves, along with promising government initiatives and high CO2 emissions, are expected to propel market growth in the next few years. Key non-rechargeable batteries are extensively used in children’s toys, light beacons, remote controls, watches, and electronic keys. These are expected to observe a loss of stake to rechargeable batteries on account of efficiency and enhanced lifespan.
Developing markets of Africa and the Asia Pacific are expected to boost battery demand in electric bicycle applications and storage applications such as the leveling of load in renewable sources of energy like the wind and solar. Growing aircraft and automobile manufacturing in developing nations of APAC, including China and India, is expected to provide enormous potential for market growth.
Growing technological advancements in battery technologies have amplified the usage of various battery-operated equipment across the world. Hybrid Electric Vehicles (HEV) are equipped with the countless features that consume a significant amount of battery power. These features include a GPS navigation system, power windows, display that give information about the battery charge level, and air-conditioning systems.
Red-Hot Battery Technology Space Poised for Great Disruption with New AI-Based Tech
How EV Battery Technologies (OTC:CRYBF) (CSE: ACDC) Aims to Solve the World’s Greatest Battery Problem and Revolutionize Batteries Forever

There’s a radical shift underway in energy, taking place in most developed countries towards renewable resources.
Lawmakers are incentivizing major energy overhauls through grants and mandates, in order to shift from traditional power generation to largescale smart power grids, and energy storage.[1],[2],[3],[4]
We’re already seeing major projects coming online right now, including a pair of giant battery storage projects in California and Florida.[5]
In the USA alone, energy storage capacity is expected to grow a whopping 12x by 2024.[6]
Over that same period, the US energy storage market is projected to grow into a $5.4 billion in 2024.[7]
By 2025, the global battery technology market is projected to be worth $152.3 billion.[8]
By 2030, both the BNEF and IEA are forecasting global energy storage will double 6 times.[9]
This is BIG business!
However, in order to get there, there are still some major technological advances are still needed to pull this off.
Completely changing over power sources isn’t easy, and at times can even be dangerous… as seen in Arizona where at one of the state’s first battery installations resulted in a fire and explosion that injured several first responders.[10]
As we scale up our capabilities for utility-scale energy storage and smart power grids, battery technology will need to assure the public of its SAFETY, EFFICIENCY, and LONGEVITY.
This is not going to be easy.
But for those who can develop the technology to handle this major transition, there is a MAJOR breakthrough investment opportunity at stake.
The field is known simply as Battery Management Systems (BMS)—an industry projected to be worth $12.6 billion by 2024,[11] and later $22.3 billion by 2030.[12]
Today, we’ve identified an incredibly overlooked BMS stock, with a plethora of battery disruptive technologies that could soon become the backbone of the energy revolution…
No, we’re not talking about Tesla Inc. (NASDAQ:TSLA).
Although, we ARE talking about one of Tesla’s most innovative competitors to date.
In their journey to launch, we believe this company has the best chance of challenging Tesla as a household within the household itself.
Just recently, they announced the specs for the launch of their Home Smart Wall technology built with state-of-the art patented AI-driven technology, that’s designed to compete with, and potentially outperform Tesla’s Powerwall.
The Home Smart Wall’s system is the “only product in the market that is able to remotely analyze and repair your battery system.”
The launch of this ground-breaking technology is set for the coming weeks, while this company hopes to be able to deliver the Home Smart Wall series to customers’ homes within 2021.
However, investors looking to capitalize on this company’s innovation don’t have to wait, as it’s not only trading publicly now, but it’s at an early-enough stage that the rest of the market has yet to take notice of the revolutionary potential of their technology before it takes off.

Bringing the Home Smart Wall and other fascinating battery breakthroughs to market is the up-and-coming stock:
Extreme Vehicle Battery Technologies Corp. (OTC:CRYBF) (CSE: ACDC).
With a growing library of BMS technology patents designed to meet the growing demand for scalable, smart solutions for both the rapidly growing Electric Vehicle (EV) and Energy Storage Solution (ESS) markets, EV Battery Tech is perfectly positioned to make 2021 an electric year for their investors.
—
Meet EV Battery Technologies
and the
5 Advantages That Position this Company

for a MAJOR Disruption in the Space
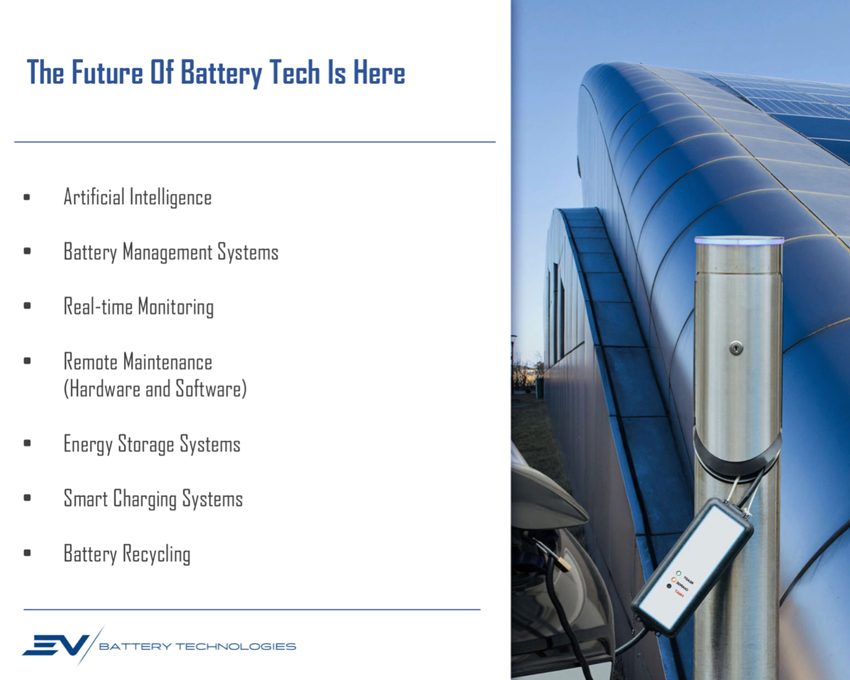
- AI-Integrated Smart BMS Technology
One of the ONLY current battery management system platforms today that offers two-way communication between the grid, the energy storage system, and the energy generation sites—providing the solutions of tomorrow TODAY. - Strategic Partnership with Established Battery Leader
EV Battery Technologies has secured a crucial partnership with Chinese preeminent battery technologies developer Jiangsu RichPower New Energy Co. Ltd, which is already supplier for Tesla and has established its own commercial market in Asia. The agreement gives EV Battery Tech exclusive rights to distribute and implement these systems in North and South America, Europe, and Africa. - MAJOR Efficiency Upgrades
EV Battery Tech’s offerings provide an improvement over the existing in multiple ways, including: Individual cell replacement within battery pack (instead of full replacement)
Repairs and real-time monitoring of each cell within the entire battery pack Remote monitoring and maintenance
AI-driven system improvements
Real-time collection of Meta Data
Life extension due to smart BMS which works and repairs cells - Ecologically Responsible and Active
EV Battery Tech (OTC:CRYBF) (CSE: ACDC) uses used/recycled batteries in all of their solutions. By doing this, their reliance upon new sources of raw materials is diminished, while also doing their part to reduce and eliminate e-waste, which in 2020 alone reached over 53 million tonnes.[13] - Dynamic Peak Shaving
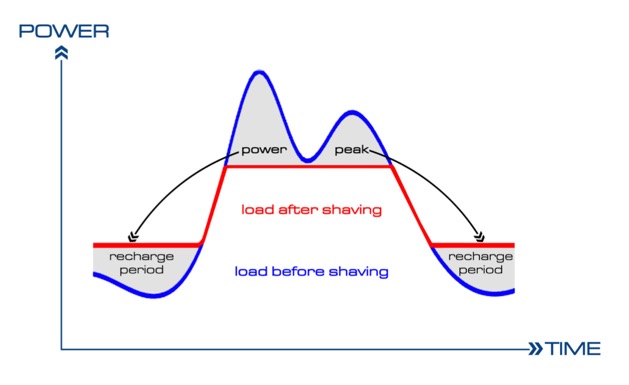
By incorporating a BMS of EV Battery Tech’s calibre, utility providers, large buildings, smart charging stations and remote industrial operations can all benefit from what’s called Dynamic Peak Shaving which means energy can be purchased outside of the grid’s peak use times to recharge the ESS, and handle large portions of the load through smart battery management during the times of greatest consumption. This provides not only better grid security, but also could represent massive savings for users who would be purchasing less energy during the times of its most expensive rates.
INTERMITTENT POWER DELIVERY, SIMPLIFIED
We’re entering an age where renewable energy is starting to dominate the discussion over where our power needs to come from.
Unfortunately, in many cases, these power sources (ie. wind, solar, wave etc.) come with challenges that need to be overcome before they can be fully relied upon.
When power is generated in those forms, the timing doesn’t always correlate with the heavier demand periods that the grid and its huge amount of consumers want it.
So whenever a utility provider talks about these types of power sources, inevitably that discussion will include what’s known as an Energy Storage Solution (ESS).
Typically when they do this, they’re referring to a lithium-ion grid-integrated solution—ie. a giant battery location.
But you can’t safely and efficiently have that without a Battery Management System (BMS).
Currently, the world is operating these projects with only basic BMS capabilities.
What Extreme Vehicle Battery Technologies Corp. (CSE:ACDC) (FSE:EVBT) offers to enhance this solution is an AI-integrated smart BMS.
As the world transitions to smart grids, this will be an absolute requirement to handle the load.
By implementing a smart BMS system, such as EV Battery Tech’s, the end-users benefit greatly from more sustainable power consumption that’s balanced out by what’s called Dynamic Peak Shaving.
This allows the system to recharge and store energy during the periods of lower consumption, and deliver energy to help carry the load during those peak times of need.
As well, this can (and should) significantly help usher in the electric vehicles revolution, which today is being hampered by inefficient charging station technology.
In the case of what EV Battery Tech (OTC:CRYBF) (CSE: ACDC) is offering, it breaks down to a “smart” vs “dumb” charging station debate.
Essentially, if a grand rollout of new infrastructure is coming to accommodate the wave of EVs hitting the roads in the years to come—it would be extremely wise if they were done “smartly”.
This means, incorporating peak dynamic shaving, remote monitoring, meeting smart grid guidelines, and collecting real-time meta data to improve efficiency.

PROVIDING THE RIGHT SOLUTIONS TO TRANSITION TO RENEWABLE ENERGY… TODAY

While there is still quite a bit of planning underway to move major population centres and energy demands over to renewables, the reality is it’s going to take some major technological advancements before we can safely make the jump.
Thankfully, EV Battery Technologies (CSE:ACDC) (FSE:EVBT) is offering one of the best solutions for this transition TODAY.
In order to get to where we need to be, there needs to be big technological shifts in everything from delivery of power to storage of power to maintenance of power… and ultimately how we consume power.
And all that requires smart Artificial Intelligence (AI) learning, which is central to EV Battery’s offerings.
However, in order to have proper AI, you’re going to need roughly 10+ years of data points gathered—all of which need to be all encompassing to be valuable.
Hence, this is where the partnership with RichPower is so crucial.
Despite the fact that EV Battery Technologies has only been trading publicly since late last year, they come fully loaded with the expertise of RichPower, which has been developing this technology for quite some time now.
In this field, RichPower’s expertise is respected and drawn upon for several new battery tech platforms. Even Tesla sources some of their materials from RichPower.
Therefore, the relationship with RichPower and its over 70 globally recognized patents give EV Battery Technologies a huge running head start.
Through the partnership agreement, EV Battery Technologies has exclusive rights to these patents in a wide variety of markets, as they launch their products into North and South America, Europe, and Africa.
—
“We are very happy to be bringing our technology to the global markets through our partner EV Battery Technologies. We are extremely proud of our technology and the market share we have captured in Asia and we are now excited to partner with EV Battery Tech to become a disruptive force in the global markets.”
– Jingke (Jack) Han, President and CEO of RichPower
—
CHINA’S COMMERCIALIZED ENERGY SOLUTIONS, NOW FOR THE WORLD’S BENEFIT

The patented technologies exclusively offered through EV Battery Technologies (OTC:CRYBF) (CSE: ACDC) provide significant improvements to the basic BMS options currently in place, including: Longer Life, Heightened Battery Use Efficiency, More Accurate Reading, Real-Time Monitoring, and Remote Maintenance.
Longer Life comes from real-time power routing options to avoid and minimize damage. This includes the innovation of exclusion and isolation of individual damaged cells. The system re-routes power by excluding these damaged cells, while delivering a notice for routine maintenance to repair or replace the problematic source.
Overall this leads to heightened battery use efficiency. By differentiating between individual cell issues in real time, the system can continue to deliver constant power optimization and flow control, while also extending the life of the battery and delivering massive cost savings.
System administrators are given the tools to accurately read the system as it is running, and make adjustments (ie. repairs, re-routings, replacements and schedule maintenance) on the fly.
“We are very fortunate to be bringing proven technology to the North American market. RichPower has not only commercialized these technologies but made a name for themselves in China. We now have the opportunity to work with them to become an early mover in the North American market.”
– Bryson Goodwin, President and CEO of EV Battery Tech
THE INVESTMENT OPPORTUNITY

While the latest release for EV Battery Technologies (OTC:CRYBF) (CSE: ACDC) targets the home through the Ionix Home Smart Wall product, the company is very much focused on targeting the even larger markets of utility-scale operations—ie. large-scale ESS sites.
Even should they capture a small percentage of those BMS contracts, and EV Battery Tech instantly becomes a very successful company.
As it stands now, the general public is likely more aware of the battery manufacturers themselves, such as Tesla, Panasonic, and Energizer, to name a few.
But the BMS space itself is lesser known, and involves a very small number of players.
So for EV Battery Tech to enter this portion of the market with a smart solution, doesn’t come with the kinds of barriers to entry as some might expect at this stage in the game.
We’re talking about an EARLY play here. This is a NEW industry unfolding before our very eyes.
And it’s growing quite rapidly, as the Global Battery Management System Market is expected to rise at an incredible CAGR of around 18.5% until 2025.[14]
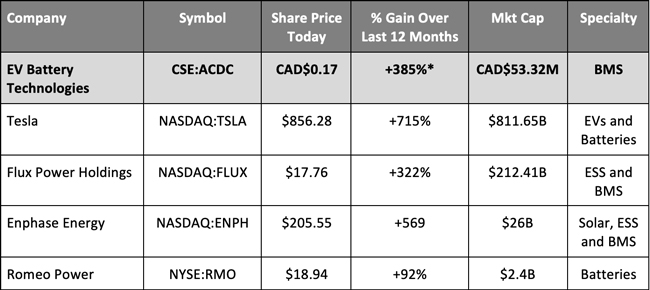
*EV Battery Technologies only began trading in October 2020.
**All prices (unless marked) in USD, and taken from Yahoo! Finance on January 12, 2021
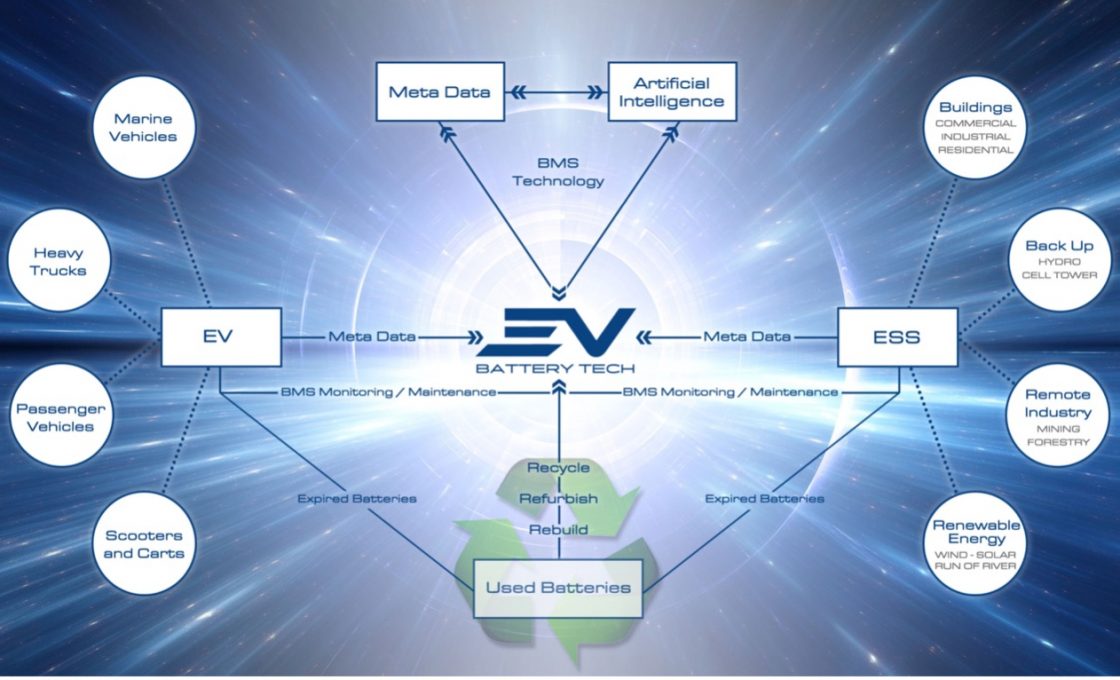
HOW IT WORKS

For any renewable energy revolution to take place, the tw o aspects of storage and management are absolutely fundamental to the success of the operation.
Right now, the newly generated energy is stored in large ESS sites, and the grid draws upon them as needed.
It’s a one-way transaction.
Where the future is going, is a two-way transaction.
The grid and the ESS need to communicate back and forth to work at peak efficiency levels.
More importantly, the BMS system—provided by EV Battery Technologies (OTC:CRYBF) (CSE: ACDC)—needs to work in a cohesive way, communicating not only with the grid itself, but also with the energy provider (ie. solar or wind generation sites).
Bringing these two entities together in harmony is key to this working out well for us.
EDITOR’S NOTE: Current BMS systems don’t do this at all!
“Our solution is pretty much the only solution of today that will meet the requirements of tomorrow, on this market of grid integration.”
– Bryson Goodwin, President and CEO of EV Battery Tech
PROVIDING THE SOLUTION FOR LI-ION BATTERIES

As it’s been stressed throughout this report, in order to achieve any grand goals of moving to renewable energy sources, it’s clear that Energy Storage Systems (ESS) will need to be in place.
Many of those in use at the moment are based on lithium-ion batteries—which EV Battery Technologies (OTC:CRYBF) (CSE: ACDC) provides solutions for.
As we transition, this form of battery may change too. However, with over ten years of accumulated data at its disposal, EV Battery Tech is well equipped to handle today’s batteries, as well as to tomorrow’s.
This isn’t just simple data, either. It’s very complex data that’s been used to train the AI to work as efficiently as possible.
EV Battery Tech’s AI-integration allows for remote maintenance and monitoring, and even in some cases allows for repair.
For safety reasons, their system will even go in and re-route power around broken or defective cells. Because of the sheer enormity of these ESS platforms, and the energy levels they contain, this type of BMS presents an absolute gamechanger, that could give more confidence to markets that have witnessed accidents such as in Arizona, and allow them to more comfortably make the switch.
By integrating EV Battery Tech’s BMS, the power supply not only can continue to deliver, but to do it safely and securely.
The applications of such a technology are vast, moving beyond just utility-scale operations, but also into medical and healthcare, telecommunications, military and defense, consumer electronics, and also electric vehicles (EVs).

—
RECAP
Before we move into the age of renewable energy, some BIG changes are needed in terms of the technology required to maintain such a system.
Thankfully, there are solutions available TODAY—and they’re coming from Extreme Vehicle Battery Technologies Corp. (OTC:CRYBF) (CSE: ACDC).
SMART. EFFICIENT. SECURE.
They’re poised to deliver BATTERY MANAGEMENT SYSTEMS that no one else today is providing, with the expertise, data, and technology behind them to truly capitalize on a MAJOR investment opportunity only seen once per generation.
Staff Editor
Equity Insider
SOURCES:
[1] https://www.starcourier.com/story/news/2020/12/09/legislators-revisit-green-energy/3865854001/
[2] https://www.shropshirestar.com/news/business/2021/01/05/aceon-joins-call-for-vat-change-on-energy-storage-technology/
[3] https://www.tdworld.com/utility-business/article/21151118/us-senate-passes-american-energy-innovation-act
[4] https://www.theguardian.com/australia-news/2021/jan/05/australia-inching-closer-to-committing-to-net-zero-by-2050-top-energy-advisor-says
[5] https://insideclimatenews.org/news/07012021/inside-clean-energy-energy-battery-storage-boom/
[6] https://www.woodmac.com/press-releases/global-storage-market-to-grow-from-12-gwh-to-158-gwh-by-2024/
[7] https://cleantechnica.com/2020/01/17/us-energy-storage-market-may-grow-12x-by-end-of-2024-interview/
[8] https://www.bloomberg.com/press-releases/2020-02-25/battery-technology-market-worth-152-3-billion-by-2025-exclusive-report-by-marketsandmarkets
[9] https://www.greentechmedia.com/articles/read/global-energy-storage-double-six-times-by-2030-matching-solar-spectacular
[10] https://www.azcentral.com/story/money/business/energy/2020/12/14/aps-restarting-battery-installation-after-fire-explosion-2019/6543414002/
[11] https://www.bloomberg.com/press-releases/2019-11-11/battery-management-system-market-worth-12-6-billion-by-2024-exclusive-report-by-marketsandmarkets
[12] https://sg.finance.yahoo.com/news/battery-management-system-bms-market-140300506.html
[13] https://www.reuters.com/article/us-global-waste-un-report-idUSKBN243255
[14] https://www.marketwatch.com/press-release/battery-management-system-market-size-to-surpass-18-cagr-2020-to-2025-2021-01-07
DISCLAIMER:
Nothing in this publication should be considered as personalized financial advice. We are not licensed under securities laws to address your particular financial situation. No communication by our employees to you should be deemed as personalized financial advice. Please consult a licensed financial advisor before making any investment decision. This is a paid advertisement and is neither an offer nor recommendation to buy or sell any security. We hold no investment licenses and are thus neither licensed nor qualified to provide investment advice. The content in this report or email is not provided to any individual with a view toward their individual circumstances. Equity Insider is a wholly-owned subsidiary of Market IQ Media Group, Inc. (“MIQ”). MIQ has been paid a fee for EV Battery Technologies advertising and digital media from the company directly. There may be 3rd parties who may have shares of EV Battery Technologies, and may liquidate their shares which could have a negative effect on the price of the stock. This compensation constitutes a conflict of interest as to our ability to remain objective in our communication regarding the profiled company. Because of this conflict, individuals are strongly encouraged to not use this publication as the basis for any investment decision. The owner/operator of MIQ own shares of EV Battery Technologies which were purchased as a part of a private placement. MIQ reserves the right to buy and sell shares of EV Battery Technologies, and will buy and sell shares of EV Battery Technologies at any time commencing immediately without any further notice. We also expect further compensation as an ongoing digital media effort to increase visibility for the company, no further notice will be given, but let this disclaimer serve as notice that all material disseminated by MIQ has been reviewed and approved by EV Battery Technologies; this is a paid advertisement, and we own shares of EV Battery Technologies that we will sell, and we also reserve the right to buy shares of the company in the open market, or through further private placements and/or investment vehicles.
While all information is believed to be reliable, it is not guaranteed by us to be accurate. Individuals should assume that all information contained in our newsletter is not trustworthy unless verified by their own independent research. Also, because events and circumstances frequently do not occur as expected, there will likely be differences between any predictions and actual results. Always consult a licensed investment professional before making any investment decision. Be extremely careful, investing in securities carries a high degree of risk; you may likely lose some or all of the investment.

Protected: Red-Hot Battery Technology Space Poised for Great Disruption with New AI-Based Tech
A Healthcare Company With A Technological Advantage
While the announcement of a COVID-19 vaccine and its disbursement at the end of 2020 was certainly a light at the end of the tunnel for the public and the embattled health care industry, hospitals and health care systems know the journey to recovery is far from over. Communities continue to see virus surges and hospitals face capacity concerns. Health care organizations must take a realistic look toward the future and begin preparing for what could be several challenging months before the pandemic’s impact is behind us. From addressing patient care and pricing needs to understanding regulatory challenges and new investment and acquisition opportunities, 2021 could be a year of fits and starts. Those organizations that plan for change and remain nimble will lead the way.
Is there a light at the end of the tunnel?
The health care industry’s response to COVID 19 has been one of resilience, persistence and commitment, especially by front-line caregivers. The pandemic has significantly shifted industry trends and accelerated the pace of change. As a result, leadership is being forced to reevaluate strategic plans to determine and evaluate how best to deliver care going forward.
Kaufman Hall’s December 2020 National Hospital Flash Report indicates that operationally, and financially, November was a challenging month for hospitals and health systems nationwide. Margins and volumes fell, revenues flattened, and expenses rose as states moved to retighten social distancing guidelines. Margins have been down consistently since the start of the pandemic, but have fluctuated from month to month. Even with mass vaccine distribution on the horizon, the report predicts that “October’s downturn likely will continue as COVID-19 rates rise throughout the fall and winter. Hospital and health system leaders are bracing for difficult months ahead, as the combined forces of the pandemic and seasonal flu drive many individuals, and local and state governments to recommit to stricter preventive measures, causing many to delay nonurgent procedures and outpatient care. The result will exacerbate volume declines and could further destabilize hospitals financially, with a potential return to the significant losses seen in March and April.”
”

To date, Department of Health and Human Services (HHS) has distributed approximately $109 billion of the $175 billion allocated to the Provider Relief Fund (CARES Act) as of mid-November, according to data released by the department. In an effort to provide additional relief, Congress voted, in December, to appropriate additional dollars to the provider relief package and changed the rules (yet again) with respect to how lost revenue is recognized.
Understanding the financial reporting and compliance requirements associated with CARES funding will continue to be important in 2021.
While it is unclear what impact and lasting influence the pandemic will have on delivery of care from a financial perspective, one thing is certain, telemedicine is not going away and has arguably had the most profound impact to the health care industry in 2020. With claims up 3,000% year-to-date over the same period the prior year, it is clear that continued investment in telemedicine and related technology will be important.

Health Catalyst reports that with the shift to telehealth, providers are entering a new business landscape as COVID-19 has broken down barriers between traditional providers and more modern telehealth and disruptive care delivery companies. In the article titled, Six Strategies to Navigate COVID-19 Financial Recovery for Health Systems, Health Catalyst reports that health care’s new competitors fall into three main buckets:
- Telehealth-only providers: Companies like MDLive and Teladoc use real physicians and offer a variety of specialties and focus a significant portion of their business on working with insurance providers and self-funded health plans to provide subscriptions.
- Direct primary care: The direct primary care companies include Go Forward, Crossover Health and One Medical. Go Forward is similar to a modern subscription concierge practice. Crossover Health partners with employers like Apple, Microsoft and Amazon to deliver care directly to employees. One Medical is a modern concierge practice that charges an annual fee and bills fee for service.
- Large corporations: Amazon, Walmart and CVS Health are entering the health care space. Amazon offers a virtual care program for their employees as well as in-home deliveries and more. They announced a partnership with Crossover Health in July to pilot employee health clinics near large centers. Walmart has opened care clinics and a virtual care system and CVS continues to build their hubs.
“Teledoc, Doctor on Demand, Go Forward and Crossover Health have business models that overlook coding, CPT codes and modifiers, and other procedures traditional organizations must follow … Amazon, Walmart and CVS Health have traditional, straightforward pricing and are redirecting care away from the traditional system into their own care delivery system,” according to the article.
As large corporations and other providers increase competition for patients, they will compete with traditional provider organizations for patients. According to a survey, 79% of primary care physicians have experienced some form of burnout and four out of five employed physicians say their health systems employers are not doing anything to combat it. With a loss of clinicians, comes loss of revenue. The disruptive care delivery companies are introducing new models of care that appeals to clinicians because they “offer less hassle,” with no coding and documenting for quality measures and the like. There’s often less stress due to lower patient volumes, and with a lot of the concierge practices and even telehealth, clinicians can somewhat choose how much volume they want, as well as more flexibility.
The pandemic is not over, and no one can anticipate what the next 12 to 24 months will bring and how it will affect health care providers. Leadership and front-line caregivers will need to continue to be resilient, persistent and quick to respond.
PRICE TRANSPARENCY
Price transparency: Why this, why now?
On Nov. 15, 2019, Centers for Medicare and Medicaid Services finalized rules requiring all hospitals to make publicly available and produce annually a machine-readable file of standard charges that includes gross charges, negotiated charges, a self-pay walk-in rate, and minimum and maximum negotiated charge for all services. In addition, CMS defined a list of 300 services whose discounted cash prices, payer-specific negotiated charges, and de-identified minimum and maximum negotiated charges must be made publicly available in a searchable, consumer-friendly format.
CMS will be monitoring compliance with methods that include evaluation of complaints made by individuals or entities, review of analysis of noncompliance by individuals or entities, and audits of hospitals’ websites. If a hospital is noncompliant, CMS may take steps ranging from a written warning notice to imposition of penalties up to $300 per day and publicizing it.
In an era of rising health care costs and diverse consumer buying preferences, the need for price transparency has taken on increasing importance.
There are many factors driving this demand with expenditures being one of them. U.S. health care expenditures and rates of inflation continue to lead the world and dominate federal expenditures. U.S. health care spending grew 4% to $3.8 trillion in 2019, which equates to $11,582 per person, according to an analysis by CMS’ Office of the Actuary released Dec. 16, 2020. This compares to 4.7% growth in 2018 and is similar to industry averages of 4.5% annual rates. The Society for Human Resource Management (SHRM) reports that “large employers project that their health benefits costs will rise 5.3% in 2021, although COVID-19 expenses are fueling uncertainty about overall expenses. The group’s 2021 Large Employers’ Health Strategy and Plan Design Survey was conducted in May and June 2020, and it captured responses from 122 large employers offering coverage to more than 9.2 million employees and dependents. Seventy-seven percent of the respondents each has more than 10,000 employees.”

SHRM reports that premiums and employees’ out-of-pocket costs are estimated to reach $14,769 per employee, up $197 from 2019. Total costs are projected to rise to an average of just over $15,500 in 2021. The pricing transparency rules are meant to provide patients the information they need to make educated care decisions and reduce cost. President Donald Trump, whose administration proposed the rules, is quoted as saying, “We believe the American people have a right to know the price of services before they go to visit a doctor.”
The American Hospital Association, Association of American Medical Colleges, Children’s Hospital Association and Federation of American Hospitals have issued statements on behalf of hospital systems indicating that they believe these rules will increase confusion because they do not achieve the goal of providing patients with out-of-pocket cost information, accelerates anticompetitive behavior among health insurers, and stymies innovation in value-based care delivery models.
While the pricing transparency rules may be a step in the right direction, we remain skeptical that these rules alone will enable patients to know the prices of services before receiving treatment. Pricing in the health care ecosystem will likely remain opaque until we have greater data interoperability between payers, providers and patients.
According to an article published by Healthcare Financial Management Association (HFMA), written by Kevin Shears and Chris Sukenik, the new rules and general market trends have six important implications for providers:
- Increased pricing visibility will expose substantial price variations among providers. This creates a need for hospitals and health systems to focus on defining and communicating their consumer value proposition. News stories will likely present providers in a negative light across major metro markets. Health systems will need to focus on sharpening and delivering on their value propositions for consumers, including individuals and employers.
- Health systems will need to deploy strategic pricing to maintain and strengthen their market
position. Health systems will have to develop a more nuanced pricing strategy to address the issue of significant price variability among providers in their area and ensure continued success in an increasingly value-focused market. - Providers will experience unit rate compression, and most of this rate movement will be price
declines. With the veil of negotiated rates lifted, health plans will be able to show how their payment rates compare with those of competing health plans in the market. As a result, health systems with rates above the market average, will be under pressure to accept lower prices during negotiations and will likely experience unit rate compression. - Providers should prepare for expanded efforts to implement reference pricing. Given the impact of COVID-19 on the economy, employers will grow increasingly willing to pursue reference pricing strategies as part of business recovery plans to control health care costs.
- Highly profitable commercial volume and market share will shift, likely from higher-priced
organizations to lower-priced ones. With commercial lives shrinking as a share of population in most markets nationally, largely because of the COVID-19 crisis, the competition for commercial lives has become more intense. Market shifts in commercial volume from higher-priced to lower-priced health systems will deteriorate the financial performance of health systems on the wrong side of the volume shifts. - Centers of excellence strategies will become an important vector for volume growth. Publicly available pricing data will accelerate the development and adoption of COE programs. The organizations that win with COE strategies will likely do so by engaging clinical leadership to quickly gain experience in developing bundled payments, developing the foundational cost and quality analytics to demonstrate and communicate results, aligning benefit design with the COE program, and cultivating strong business relationships with leading employers and health plans.
These new rules have significant and far-reaching implications for all health care systems, and after initial implementation, ongoing monitoring and analysis of these six areas will continue to be critical as organizations evaluate and make decisions about their delivery models and related pricing.
DEAL FLOW
Solid health care provider deal flow will persist as healthtech grows
2020 has been a solid year for health care services investment from both financial buyers, e.g., private equity, and strategic or corporate buyers. Despite the global pandemic putting a halt to most deal flow during the summer, 2020 capped off a 10-year run, post-global financial crisis that saw $822 billion invested into health care service providers across 11,054 deals, according to PitchBook data. Private equity-backed deals accounted for 28% of dollars invested ($231 billion), and 48% of total deal volume (5,355 deals). Corporate deal activity, such as CVS acquiring Aetna, accounted for the balance.

Since the end of the global financial crisis, private equity’s deal activity within health care service providers has increased in total, and private equity’s proportion of deal flow relative to corporate activity has increased from approximately 40% to 60% over time.
We expect private equity investors will continue to show moderate growth in capital deployed and strong growth in deal count in the near term.

Consolidation has led many private equity investors to move downstream and evaluate smaller deals as they search for opportunities to bring synergies and value to more providers. Particularly in the aftermath of the COVID-19-related public health emergency, many independent providers experienced financially lean periods and have become motivated sellers.
The pandemic also pulled forward interest in health care technology as millions of patients and thousands of physicians used virtual health services for the first time. So while the opportunity for investment in physical service providers will eventually decline as the sector consolidates, the door will open to health care technology investment.
Historically, health care has underinvested in (nonmedical) innovation relative to other sectors, particularly financial services, which is also highly regulated. Health care venture capital and corporate mergers and acquisitions investment in health tech post-global financial crisis represented 6% of annual sector revenue compared to the 62% the financial services sector had similarly invested in fintech.
Patients are demanding the same customized, on-demand experience for their health care that they receive in most other aspects of their lives. Companies and investors that can deliver that experience will be positioned to capture significant long-term tailwinds.

As of this writing, we are uncertain how the regulatory environment may change with the Biden administration. Vice President Kamala Harris and incoming Health and Human Services Secretary Xavier Becerra have histories of health care mergers and acquisitions scrutiny during their separate tenures as attorneys general of California. Time will tell what effect the administration may have on the overall health care M&A environment.
REGULATORY
Legislative and regulatory outlook for health care
Health care has long been an industry heavily affected by legislation and regulation. As we look forward to the first quarter of 2021 and beyond, we continue to expect that to be true. In 2020, the industry saw nearly $200 billion in stimulus payments to help provide some relief from the financial effects of the pandemic. However, with the speed of the rollout, it did present challenges to many of our clients when determining how to meet the terms and conditions of the Provider Relief Fund grant. With the passage of the Consolidated Appropriations Act, 2021, some of those challenges subsided.
What did the Consolidated Appropriations Act, 2021 (the Act) do and how will it affect 2021 for the health care ecosystem? From a challenges perspective the Act mainly provided two things: one, the Act, yet again, changed the calculation of “lost revenue;” however, in this round the changes are largely beneficial to allow for an actual budget calculation rather than a strict year over year methodology. Two, it provided an opportunity for providers that are parent organizations with subsidiaries that received targeted distributions to allocate those distributions to other eligible health care providers within the organization. The Act also provided for many of what is referred to as the “Medicare extenders.” An example of this would be eliminating the Disproportionate Share Hospital cuts.
For many recipients of the Provider Relief Funds, the change to the determination of lost revenue and the flexibility to allocate targeted distributions as well as the Medicare extenders will allow for them to enter 2021 with a bit more financial certainty. Many providers found themselves in a predicament when the calculation of lost revenue was defined for calendar year 2019 versus calendar year 2020. As shown below, through November 2020, many providers had growth in revenues rather than reductions. Many factors contributed to growth in 2020 by providers. However, despite the growth, the providers were not growing as fast as they had budgeted, which then provided profitability concerns as the budgeted revenues drove decisions around expenditures, many of which were fixed.
As shown in the chart, while the average provider grew revenue year over year (adjusted for Provider Relief Funding), they experienced a shortfall relative to the budget of 2.3%. Given the operational leverage typically present in providers, which was exacerbated by prohibitions on nonemergent or elective procedures, this caused expenses per adjusted discharge to exceed budget by 15.9% on average.

In addition to the stability provided by the Provider Relief Fund, many health care providers with large investment balances saw a year of growth within their investment portfolios as well as increased philanthropic activities. With the stability and more financial certainty, we expect most health care providers to continue with the majority of their planned expenditures.
The $1.4 trillion government funding bill, which was passed alongside the Act, also included legislation aimed to protect patients from so-called “surprise billing” for emergency services and other instances in which a patient is unknowingly treated by an out-of-network provider. The “No Surprises Act” would cap patients’ out-of-pocket responsibility for emergency care to what they would pay for in-network services. Providers are also unable to bill out of network for planned procedures unless the patient gives explicit consent. Billing disputes for covered procedures would be handled in arbitration. One key change is the No Surprises Act forbids arbiters to consider Medicare and Medicaid rates or the provider’s billed charges when ruling for the amount the insurer should pay the provider. The patient cannot pay more than the in-network rate and is not involved in the arbitration process.
The No Surprises Act will likely reduce total patient responsibility for care and may reduce total revenues for certain providers. Payers will not be able to reference the generally low rates of Medicare or Medicaid in arbitration, but nor will they have to disclose pharmacy benefit manager relationships and rebate structures, which previously proposed bills called for. It remains to be seen whether this legislation will fundamentally change how care is provided and the viability of certain provider business models, or if it is simply step one of a much larger change to the regulatory and legislative environment. However, we also note the pandemic has caused some to consider their physical footprint versus their digital presence.
CYBERSECURITY
Reported breaches continue to rise
Cybersecurity and data protection continue to be a point of concern within the health care industry. Over the last few quarters in 2020, we have seen an increase in the number of hacking incidents as attackers continue to leverage the pandemic for their own benefit. Although many organizations claim to have a sophisticated cybersecurity program, attackers continue to gain access to patient financial and medical information. If proper protocols are in place, why do the attacks continue? RSM security and privacy risk professionals state two ways cybercriminals break into health care organizations:
- Remote workers exposing the organization to phishing emails, ransomware and vulnerable storage locations
- Third-party vendors and partners transferring the organization’s data insecurely from system to system
As a result, there has been a significant increase in the number of individuals affected by health care data breaches within the past five months. For example, in the month of September 2020, there were over 9 million individuals affected by 87 data breaches (an increase of 373% compared to September 2019) reported to the Office of Civil Rights. Further, 68% of the total breaches reported to the OCR during 2020 were related to a hacking/information technology incident affecting 23 million individuals.


The 2020 NetDiligence Cyber Claims Study indicates that attackers are shifting their preference to small and midsized organizations, which explains the increase in breach reports within the health care industry over the past five months.
This shift in focus leaves the health care industry vulnerable to exploitations during a time where most organizations are cutting their IT budgets and resources in response to the pandemic.
According to Black Book Research, 88% of providers revealed that lack of budget was the major obstacle to properly securing and protecting health information, up from 68% in 2019. Eighty-two percent of hospital chief information officers in inpatient facilities under 150 staffed beds and 90% of practice administrators collectively state they are not even close to spending an adequate amount on protecting patient records from a data breach.


According to the 2020 NetDiligence Cyber Claims Study, a data breach on average costs small to midsize organizations $276,000 (per claim) in lost business income and $26,000 in recovery expenses alone. It is important for health care organizations to evaluate their exposure to cyberrisks. Reduced IT budgets and resources are contributing to an increase in attacks and incident costs. While most large organizations would seem to be the prime target for attackers, small to midsize organizations have experienced the most attacks, contributing to over 98% of the study’s claims. It is no longer a matter of “if” but “when” health care organizations will be the target of a cyberattack, and to ignore such a risk will prove to be extremely costly.
In assessing the overall cost/benefit of investing in a robust cybersecurity program, health care organizations should evaluate the costs to address a breach, which includes the following:
- Cyber incident costs: costs associated with investigating the incident (averaging about $123,000 per claim)
- Service costs: costs associated with hiring breach counsel, forensics, notifications, credit monitoring and public relations (averaging about $78,000 per claim)
- Legal costs: costs associated with lawsuit defense, lawsuit settlement, regulatory action defense and regulatory fines (averaging about $401,000 per claim)
In the coming months, we expect these costs and the reported number of attacks to continue to rise. As a result, health care organizations must be diligent and increase their focus on data security over patient information and the systems they use to treat them.
Sources:
 Amazon’s Chinese sellers to raise prices or quit US market as tariffs hit 145%
 Mortgage rates march higher despite delay of some tariffs
 U.S. stock futures fall after sharp rally on Trump tariff reversal
 Is Broadcom Inc. (AVGO) the Best Stock for 15 Years?
 US stocks, dollar tumble as Trump’s trade war rattles Wall Street
 Japan stocks plunge over 5% as Asia-Pacific markets resume sell-off on U.S.-China trade war worries
 Android Auto update hints at navigation with ‘Glasses’
 Inflation rate eases to 2.4% in March, lower than expected; core at 4-year low
 The year is 2025, and Instagram is reportedly ‘working on’ an iPad app
 Retiring? Navigating Social Security and a 401(k) amid tariffs