Sumitomo Chemical Company, Limited (TSE:4005), TEGNA Inc. (NYSE:TGNA): Are Shares Undervalued?

Sumitomo Chemical Company, Limited (TSE:4005) has a current MF Rank of 5747. Developed by hedge fund manager Joel Greenblatt, the intention of the formula is to spot high quality companies that are trading at an attractive price. The formula uses ROIC and earnings yield ratios to find quality, undervalued stocks. In general, companies with the lowest combined rank may be the higher quality picks.

Intel Corporation (INTC) Bullish Structure Favors More Upside

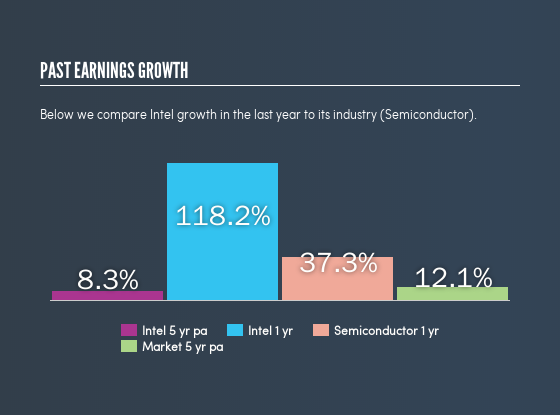
Looking at the company’s fundamental situation, Intel’s  (INTC[NGS] – $58.49 0.07 (0.12%)    Trade ) return on total capital is 23.43% and its return on invested capital has reached 20.60%. Its return on equity is 29.33%, and its return on assets is 16.76%. Intel’s year-on-year earnings growth rate has been positive over the past 5 years, and its 1-year earnings growth exceeds its 5-year average (118.2% vs 8.3%).

Intel INTC Earning Growth

All the above metrics suggest that Intel is adept in using its earned income to generate more returns which is reflected in its stock performance as it remains an investor favorite.

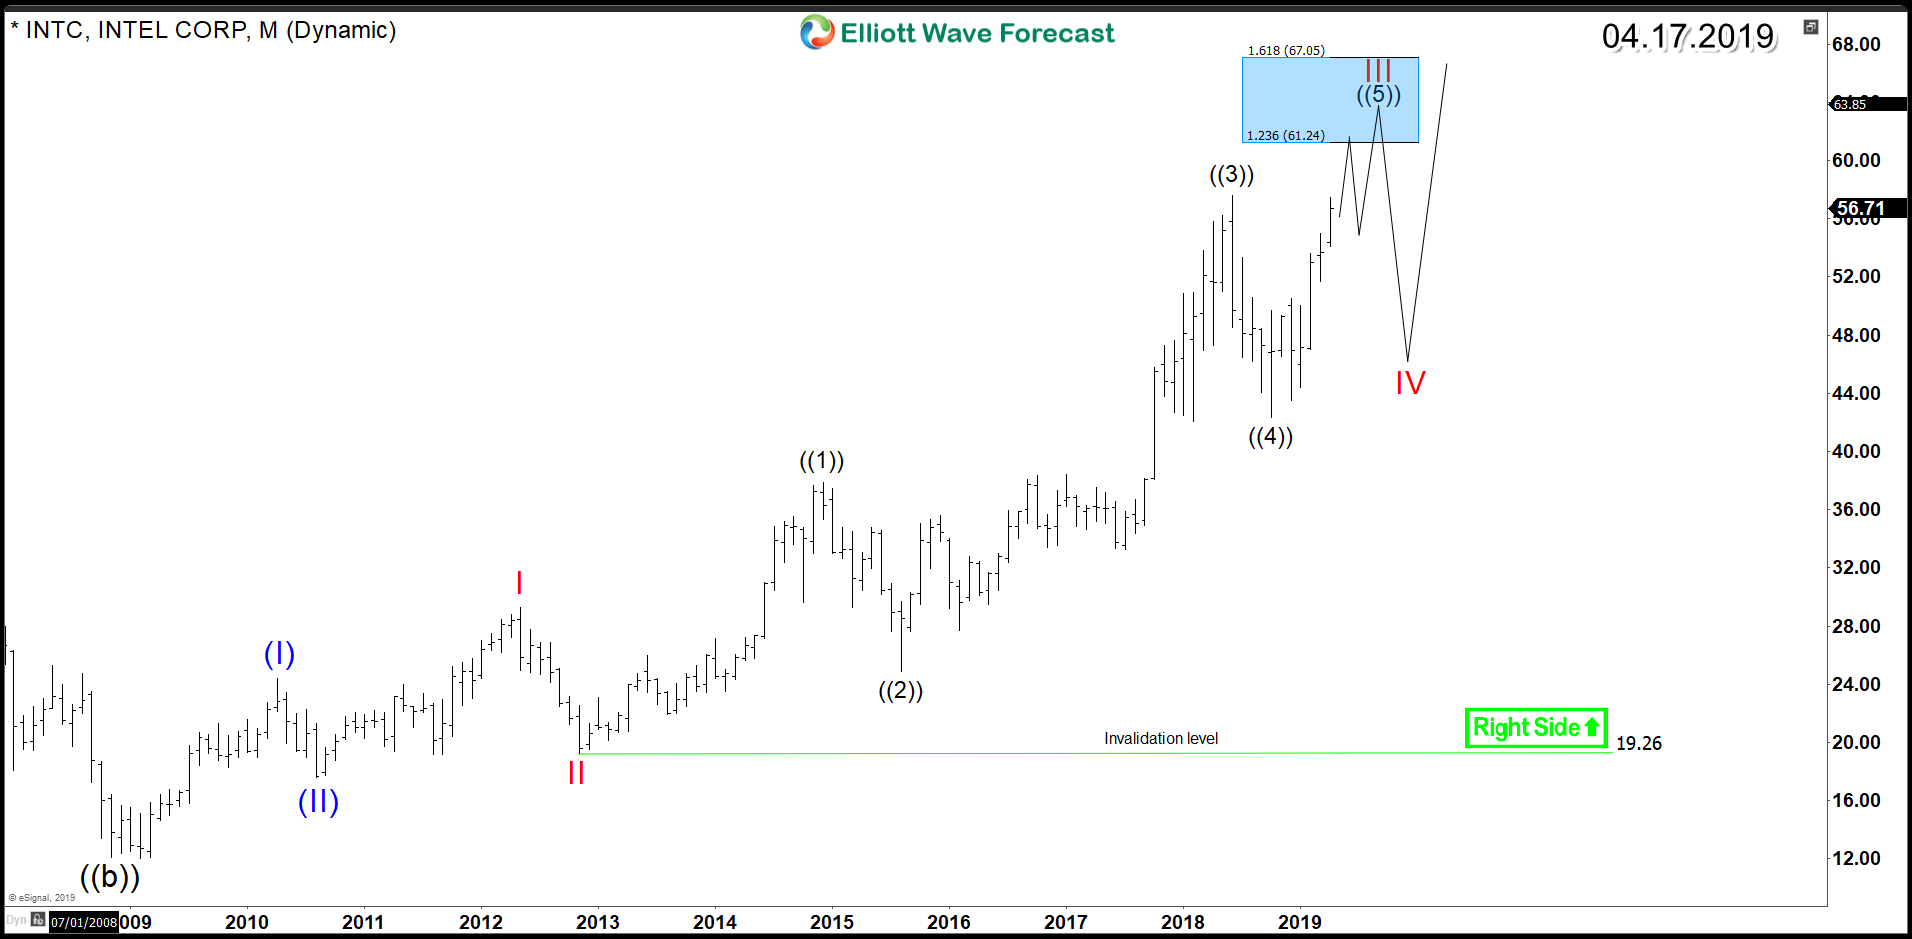
Based on Elliott Wave Theory, INTC has been rallying in an impulsive waves structure since its 2008 low, and the cycle is extending higher within the strongest 3rd wave. As presented on the monthly chart, the stock is looking for the target area at $61.24 – $67.05 to end wave III, followed by a pullback in wave IV, after which the stock is projected to resume the move higher.

INTC Elliott Wave Monthly Chart

Intel INTC 4.17 Monthly

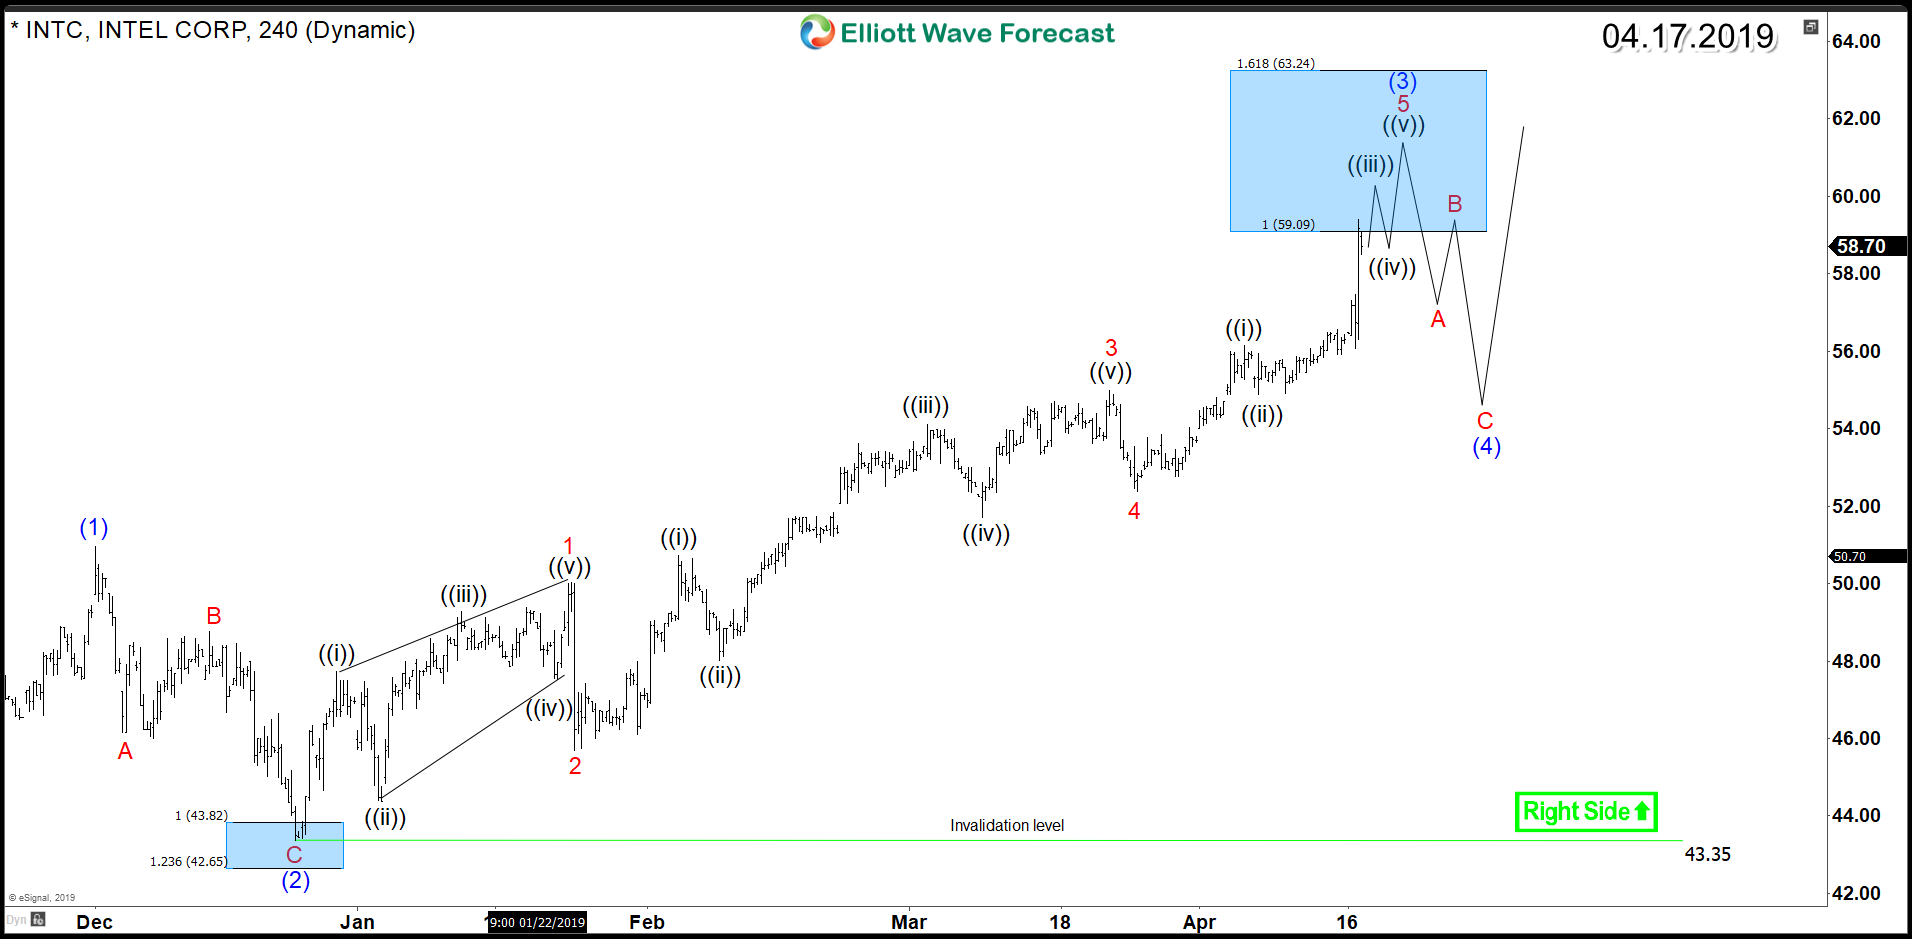
Consequently, the mid-term focus will be on the current cycle from the October 2018 and December 2018 lows. INTC is already showing 5 waves up from its $43.35 low, reaching the minimum target area $59 – $63. Short term buyers need to be careful at this stage as a 3 waves pullback can be seen.

A correction in wave (4) is expected to find buyers in 3, 7 or 11 swings as long as the pivot at the December 2018 low remains intact for the stock to continue the rally higher as a 5 waves structure from the October 2018 low.

INTC Elliott Wave 4H Chart

Intel INTC 4H Chart 4.17.2019

In conclusion, Intel’s technical and fundamental picture is strong on both sides and the stock is aiming for further gains in the future. Therefore Investors are advised to watch INTC closely for a buying opportunity during the next pullback.

We Are Bullish on Emerging Markets

Executive Summary

1. We are bullish on emerging markets, which are looking up.We wrote last week that we saw the stars aligning for 2019 to be the year that emerging markets finally wake up from their slumber. This week, we discuss the signs we see a little further. Foreign investor sentiment on emerging markets is rebounding, with flows into emerging-market ETFs growing year-to-date and in the past 12 months. The Chinese government is continuing to ease, trying to stimulate the Chinese economy in ways that will not worsen the leverage problems in its financial system; those efforts are beginning to bear fruit, both in economic data, and in sentiment among Chinese investors and small business owners. Valuations of emerging-market stocks are not stretched; presently they are just near their long-term average, and have room to expand. Most importantly, perhaps, most central banks around the world, from the U.S. Federal Reserve, the European Central Bank, and the Bank of Japan, to the People’s Bank of China and the Reserve Bank of India, are easing in response to the global growth deceleration that occurred in 2018. If the experience of the whole post-crisis period means anything, this easing will be supportive of economic growth and investor sentiment, and of asset prices generally — especially stocks.

Vectrus Inc. (VEC) Plunges 7.74%

Vectrus Inc. (VEC) had a rough trading day for Tuesday April 16 as shares tumbled 7.74%, or a loss of $-3.02 per share, to close at $35.98. After opening the day at $38.01, shares of Vectrus Inc. traded as high as $40.36 and as low as $35.81. Volume was 296,483 shares over 2,946 trades, against an average daily volume of n/a shares and a total float of 11.35 million.

Ambarella Inc. (AMBA) Soars 5.52%

Ambarella Inc. (AMBA) had a good day on the market for Tuesday April 16 as shares jumped 5.52% to close at $49.32. About 748,953 shares traded hands on 6,789 trades for the day, compared with an average daily volume of n/a shares out of a total float of 32.72 million. After opening the trading day at $47.00, shares of Ambarella Inc. stayed within a range of $49.39 to $46.84.

FuelCell Energy Inc. (FCEL) Plunges 9.96% on April 16

FuelCell Energy Inc. (FCEL) had a rough trading day for Tuesday April 16 as shares tumbled 9.96%, or a loss of $-0.0274 per share, to close at $0.25. After opening the day at $0.26, shares of FuelCell Energy Inc. traded as high as $0.27 and as low as $0.24. Volume was 6.54 million shares over 13,029 trades, against an average daily volume of n/a shares and a total float of 129.5 million.

error: Content is protected !!