Weekly Market Review – September 12, 2020

Stock Markets

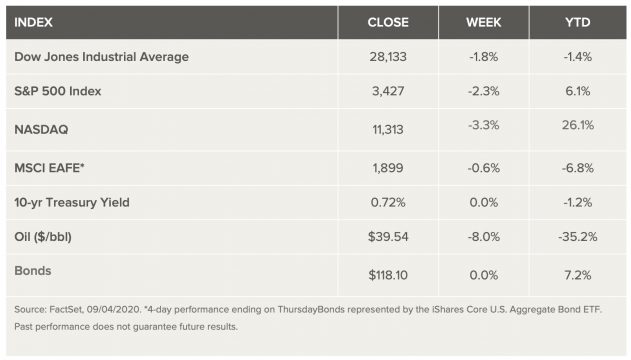
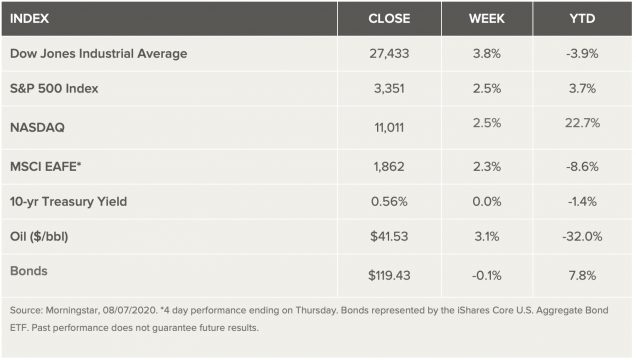
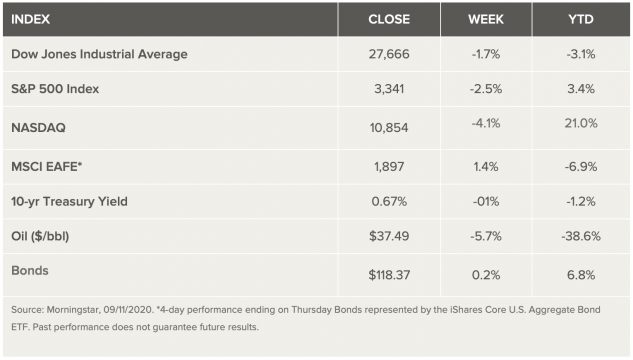
Stocks declined for the second straight week, as technology stocks experienced their worst pullback since March. There was no single catalyst for the move lower, which left the Nasdaq about 10% below its all-time high reached just six trading days ago. However, broad valuation concerns, skepticism about a compromise on a coronavirus stimulus package before the election, and signs of slowing progress in the labor market all contributed to the negative sentiment. Analysts continue to believe a longer-term recovery is under way, but stocks are likely to enter a more volatile period than the one experienced during the summer months. The path forward could be bumpier and the pace of the recovery slower, and as a result, stocks could start to consolidate some of the recent gains.

US Economy

Last week stocks fell 2.5%, posting their second consecutive week of losses1. We don’t think that last week’s pullback is a sign that the rally has come to an end. But it does highlight the view that we’ve reached a bumpier stage in the economic recovery, prompting occasional downward swings in stocks even as the overall rally continues. Despite the unprecedented, unpredictable and unruly path of the COVID-19 pandemic, we’ve observed a pattern to the economic recovery to date that analysts believe can be defined by three distinct stages:

Stage 1: A severe recession

Stage 2: A sharp early rebound

Stage 3: A slow recovery back to pre-pandemic levels.

Because the economic fundamentals supporting the rally are likely to be less vigorous as we move from Stage 2 of the recovery to Stage 3, analysts expect occasional pullbacks in the equity rally. Maintaining diversification across asset classes, sectors and geographies can help investors reduce the impact of temporary downward swings on long-term portfolio performance within the broader market climb. Despite the bumpier growth path ahead, focusing on achieving financial goals over time rather than on short-lived market moves can help make the economic journey from recession to recovery a smoother ride for investors.

Metals and Mining

Gold remained in the green on Friday after seeing some volatility late in the week. A strengthening US dollar pulled the yellow metal back late in the session, although fears of a prolonged economic recovery continued to benefit the precious metals. The base metals weren’t as lucky, spending most of the second week of September trending lower. Gold was on track to end the week higher after spending the last half of August moving lower. The currency metal started the week at US$1,929.70 per ounce before volatility brought it to US$1,913. A subsequent rally drove the value of the yellow metal to US$1,962.80, a three-week high. Silver also moved higher this week despite experiencing some headwinds mid-session. Its price fell to US$26.04 per ounce on Tuesday and had surged past US$27 by Thursday. After testing the US$29 threshold in August, the white metal has held below US$28. The platinum price climbed 3 percent this session, reversing a steady decline that started in mid-August. After dropping to US$600 per ounce in March, platinum has added 32 percent to its value and is approaching its year-to-date high of US$1,022, set on January 17. On Friday, platinum was selling for US$932.50. While the other precious metals experienced a price slump in mid-August, palladium’s story was the opposite. The automotive metal steadily ticked higher through the first week of September before facing some resistance. Palladium started the session at US$2,197 per ounce, before slipping to US$2,135. By Friday morning, palladium was moving for US$2,208.

Copper felt pressure this session, but even though it ended the week 1 percent lower, the base metal has surpassed its January high of US$6,300 per tonne. After hitting a year-to-date high of US$2,554 on September 1, the zinc price has been on the retreat. The steady run-up that the metal saw in July and August has now consolidated after resistance set in. That said, the price pressure may be temporary as mine supply is still being impacted and seasonal slumps are starting to dissipate, which may set the stage for new price highs. Zinc was selling for US$2,383 on Friday. Nickel also marked its year-to-date high in early September, when its price hit US$15,660. Analysts at Fastmarkets note that the metal’s late-summer bump was likely the result of Tesla (NASDAQ:TSLA) CEO Elon Musk calling for more nickel mining. Lead took a drastic dip this week — the metal opened at US$1,961.50 per tonne and had shed 5.2 percent by the end of week. Despite the dramatic slump, lead values are still holding at their pre-pandemic levels after falling to US$1,578 in May. Friday saw the lead price sitting at US$1,859.

Energy and Oil

Oil prices edged up just a bit during midday trading on Friday, with Brent climbing back above $40 per barrel. Sentiment remains more pessimistic than in previous weeks. Low prices are hitting OPEC+ members, just as they began ramping up production. Should OPEC stay on course with the cuts, hoping that demand recovery picks up next year, enduring low-for-longer oil prices that crush OPEC budgets? Should they cut deeper? ExxonMobil suspended work on a third floating production, storage and offloading vessel in Guyana. The company awaits approval from the government of Guyana for its Payara project. Natural gas spot prices fell at most locations this week. The Henry Hub spot price remained flat at $2.19 per million British thermal units (MMBtu). At the New York Mercantile Exchange, the price of the October 2020 contract decreased 8¢, from $2.486/MMBtu last week to $2.406/MMBtu this week. The price of the 12-month strip averaging October 2020 through September 2021 futures contracts declined 1¢/MMBtu to $2.964/MMBtu.

World Markets

Stocks in Europe rose on the continuing economic recovery, shaking off disappointment that the European Central Bank (ECB) did not announce additional stimulus, as well as renewed fears of a hard Brexit. In local currency terms, the pan-European STOXX Europe 600 Index ended the week 1.67% higher. Germany’s Xetra DAX Index rose 2.80%, France’s CAC 40 added 1.39%, and Italy’s FTSE MIB advanced 2.21%. The UK’s FTSE 100 Index gained 4.02%, which benefited from weakness in the British pound. UK stocks tend to gain when the pound falls because many companies in the index are multinationals that generate meaningful overseas revenues.

Mainland Chinese A-shares shed roughly 3.0%, taking their cue from the U.S. sell-off. In addition to the U.S. tech stock downturn, news that the Trump administration was considering adding Semiconductor Manufacturing International Corporation (SMIC), China’s top chip foundry, to a list of U.S.-sanctioned companies dealt a blow to investor sentiment. Shares of many Chinese technology companies fell on the news, reflecting SMIC’s importance as a key semiconductor supplier to the domestic market and the company’s close ties to Beijing and the defense industry.

The yield on China’s 10-year sovereign bond was unchanged. The tone of China’s fixed income market remained firm: Term spreads have narrowed since June, as have the spreads between bonds with the same maturity but different credit ratings. Most analysts expect domestic liquidity conditions will improve in September, providing a positive backdrop to the bond market. The yuan rose 1.7% against the U.S. dollar.

The Week Ahead

Economic data being released include industrial production on Tuesday, retail sales along with the Federal Reserve interest rate decision on Wednesday, and consumer sentiment on Friday.

Key Topics to Watch

  • Empire State index
  • Import price index
  • Industrial production index
  • Capacity utilization rate
  • Real median household income
  • Poverty rate (supplemental rate)
  • Uninsured rate (health insurance)                            
  • Retail sales
  • Retail sales excluding autos
  • NAHB homebuilders’ index
  • Business inventories
  • Federal Reserve meeting announcement                                         
  • Federal Reserve Chair Jerome Powell press conference                                          
  • Initial jobless claims (state program, SA)
  • Initial jobless claims (total, NSA)
  • Continuing jobless claims (state program, SA)
  • Continuing jobless claims (total, NSA)
  • Housing starts
  • Building permits
  • Philly Fed manufacturing index                     
  • Current account deficit
  • UMich consumer sentiment index (preliminary)

Markets Index Wrap Up
This image has an empty alt attribute; its file name is markets-weekly-9-12-2020-633x360.jpg
Weekly Market Review – September 5, 2020

Stock Markets

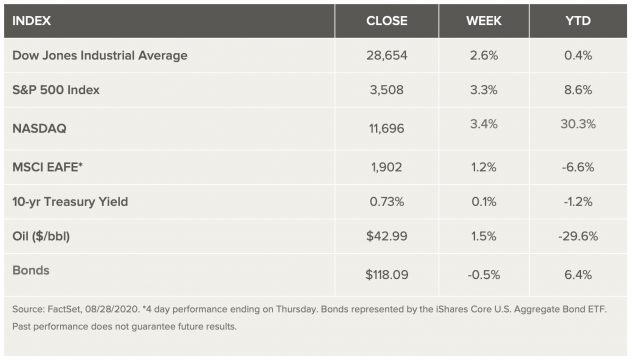
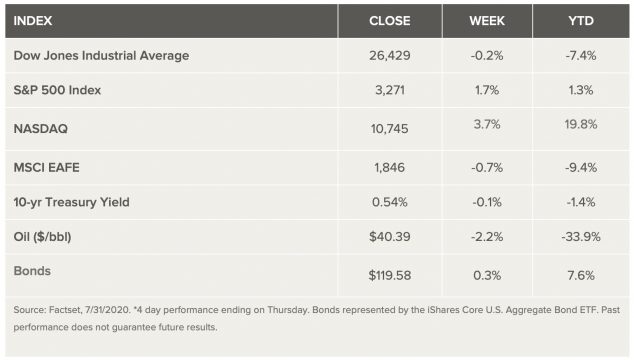
The equity markets saw volatility return last week, with Thursday seeing declines of 3% and Friday 1%1. Before this last week, the S&P 500 advanced for four straight weeks, with technology stocks leading the index to a new record high. The strength of the stock market, though, seemingly disconnected from current economic fundamentals, has been supported to date by aggressive fiscal and monetary stimulus and stronger-than-expected economic indicators of future growth. The Department of Labor released data last week showing initial jobless claims coming in at 881,000, beating analysts’ estimates. The economy also added 1.4 million jobs in August, with 10.1% growth in productivity. On the trade front, the U.S. deficit reached a 12-year high.

US Economy

We’re two-thirds of the way through 2020, but the year so far has produced more than its fair share of extraordinary statistics. With Labor Day bringing the unofficial end to an unusual summer, here’s some of the year’s unusual figures and where they are now:  While market volatility increased sharply this year, it was particularly notable in March, which included a single-day decline of 12% — the second-worst day in the last 50 years – as well as two 9% daily gains (the third- and fourth-best days) a handful of days apart. After bottoming in late March, the stock market has been on a steady path higher, with relatively modest fluctuations along the way, including only 22 daily moves larger than 2% during that time. Last week saw a return of volatility, with the market falling 3% on Thursday, as many of the higher-flying segments of the market, such as tech stocks, sold off following a lengthy winning streak. Analysts don’t see this as the beginning of a new broader direction lower for the market, but instead a more normal breather for a market that has been on quite a run.

Metals and Mining

The bears in gold could only manage one day in keeping prices down as the yellow metal bounced back Friday from a brief selloff across markets forced by the shock collapse of U.S. gross domestic product in the second quarter.

“Gold mania continues and after tentatively clearing the $2000 level, traders are starting to doubt whether a profit-taking pullback is in the cards,” said Ed Moya, analyst at New York-based online trading platform OANDA. Spot gold, a real-time indicator of trades in bullion, last traded up $19.47, or 1%, at $1,976.11. It fell a meagre 0.6% in the previous session, touching a session low of $1,939.69 that remained well above the level it attained when it rewrote for the first time this week record highs from 2011. On New York’s Comex, the August futures contract last traded up $28.90, or 1.5%, at $1,971.20 before expiring and going off the board. On Thursday, August fell just 0.5%. For July, Comex gold ended up 9%, for its biggest monthly gain since February 2015. For the year, gold futures are up 28%. Further, December gold hit a record high of $2,005.40 in Friday’s Asian session, before the start of European and U.S. trading. That also means the new front-month for Comex would likely aim for a higher peak in the new week to sate gold bulls pursuing $2,000-territory.

Moya expounded that “Gold will continue to shine bright as real yields continue to fall deeper into negative territory, virus surges will keep economic recoveries limited, and the stimulus trade will not go away until the labor market bounces strongly back.” Silver, which rallied along with gold through most of July, rose 36% for the year, outperforming not just the yellow metal but the entire commodities complex as well. Silver’s front-month contract on Comex, September, last traded up $1.263, or 5.4%, on Friday at $24.625 per ounce.

Energy and Oil

Oil prices hit a rough patch this week, falling back in concert with broader financial markets. The dollar gained strength, which also pushed down crude. The demand rebound is also sputtering. WTI was driven below $40 for the first time since June. Iraq is looking for an exemption from the OPEC+ deal for the first quarter of 2021, raising fears that the group’s compliance may start to slip. A separate report says that Iraq wants a two-month extension on the extra production cuts that it agreed to implement in August and September. Kuwait’s budget deficit is expected to reach $46 billion this year. But oil revenues collapsed after the 2014-2016 downturn and never recovered. Now the country is grappling with tapping its sovereign wealth fund as the days of huge oil revenues appears to be over.  A new report from the European Commission warns that the shortage of critical materials could threaten the EU’s push to become climate neutral by 2050. The EU estimates that it will need up to 18 times more lithium and five times more cobalt in 2030, a figure that rises to 60 times more lithium and 15 times more cobalt by 2050. Natural gas spot price movements were mixed this week. The Henry Hub spot price fell from $2.51 per million British thermal units (MMBtu) last week to $2.19/MMBtu this week. At the New York Mercantile Exchange (Nymex), the September 2020 contract expired this week at $2.579/MMBtu, up 12¢/MMBtu from last week. The October 2020 contract price decreased to $2.486/MMBtu, down 9¢/MMBtu from last week to this week. The price of the 12-month strip averaging October 2020 through September 2021 futures contracts climbed 10¢/MMBtu to $2.973/MMBtu.

World Markets

European shares pulled back in sympathy with the technology-led decline in U.S. equities. However, news of merger talks between Spanish lenders Bankia and CaixaBank helped to curb losses. In local-currency terms, the pan-European STOXX Europe 600 Index ended the week 1.76% lower. Germany’s Xetra DAX Index fell 1.46%, France’s CAC 40 slid 0.76%, Italy’s FTSE MIB declined 2.27%, and the UK’s FTSE 100 Index dropped 2.76%.

An early estimate of eurozone consumer prices showed inflation of -0.2% in August—the first decline since May 2016—heaping more pressure on the European Central Bank (ECB) to increase stimulus. Speculation that the ECB would have to act soon to counter a stronger euro had mounted before the release of the latest data on consumer prices. The euro’s strength is worrying policymakers, who warned that further appreciation would weigh on exports, drag down prices, and hold back the economic recovery, according to the Financial Times newspaper. Evidence of this unease emerged earlier when the euro briefly rallied to more than USD 1.20 for the first time since 2018, prompting ECB Chief Economist Philip Lane to say the euro-dollar rate “does matter” for monetary policy. The consensus calls for the ECB to keep its policy settings unchanged at its meeting next week.

Mainland Chinese stock markets fell, with both the large-cap CSI 300 and benchmark Shanghai Composite Index shedding 1.5% following the overnight sell-off on Wall Street. The yield on China’s 10-year bond increased and ended the week at 3.14%.

The People’s Bank of China (PBOC) and the State Administration of Foreign Exchange (SAFE) announced simpler rules to facilitate trading of domestic bonds by overseas investors. Under the new measures, foreign investors can access onshore foreign exchange and rate-hedging tools and invest in exchange-traded bond products. Separately, the PBOC said on August 31 that the depositary institutions repo rate (DR) would now be the key short-term reference rate. Following the move, DR rates will become the pricing basis for most money and liquidity products. Along with the medium-term lending facility rate, the new key rate will form the backbone of China’s policy rate system and brings the country a step closer to the rate-setting systems of other major central banks.  

The Week Ahead

Important economic releases this week include Consumer Credit, CPI data, and hourly earnings growth.

Key Topics to Watch

  • NFIB small-business index
  • Consumer credit
  • Job openings
  • Initial jobless claims (regular state program, SA)
  • Initial jobless claims (total, NSA)
  • Continuing jobless claims (regular state program)
  • Continuing jobless claims (total, NSA)
  • Producer price index
  • Wholesale inventories
  • Consumer price index Aug.
  • Core CPI
  • Federal budget

Markets Index Wrap Up

This image has an empty alt attribute; its file name is markets-week-9-5-2020-631x360.jpg
Weekly Market Review – August 29, 2020

Stock Markets

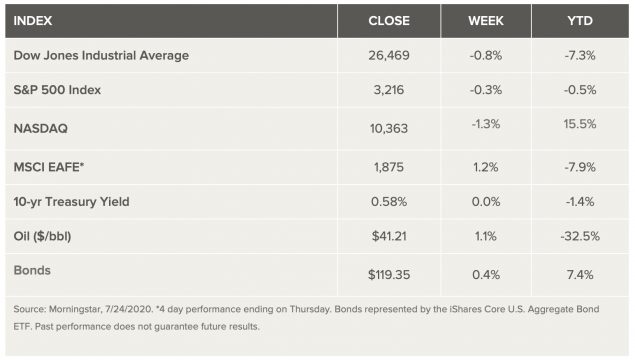
Markets finished higher last week, on track for its best August in 34 years, and continuing the rally after the third bear market in two decades. The S&P 500 is up nearly 52% since the bear market bottom on March 23, and is up nearly 8% for the year, posting a new record high of 3,4941. The chairman of the Federal Reserve Board, Jerome Powell, stated last week that the Fed will let inflation run slightly higher than the traditional 2%, meaning rates will stay lower for longer, which is a tailwind for equities. Personal spending rose 1.9% in July, the third month in a row showing growth, indicating that the economic recovery is underway.

US Economy

The health, social and economic effects of COVID-19 continue to be felt, but that hasn’t stopped stocks from marching higher. The S&P 500 closed at another record high last week and is on track to log its best summer performance (June – August) since 1938 and its best August since 1981. The market is wrapping up the summer in a much different position than it was in just a hand full of months ago, reflecting this year’s evolving (and unusual) conditions.

The last three months provided additional evidence that the economy is gradually exiting a deep recession, with data hinting to a sizable bounce in the third quarter. A real-time forecast from the Federal Reserve Bank of Atlanta estimates that third-quarter GDP will grow 26% following a 32% annualized decline in the second quarter. If this proves to be the case, by the end of September the economy will have recovered half of its pandemic-induced losses, leaving real GDP about 5% below its pre-crisis level. Still a lot of ground to cover, but a good first step.

Metals and Mining

After two weeks of losses, gold was poised to end the last week of August up almost 2 percent, reversing a brief slump that saw the metal dip to US$1,917 per ounce on Wednesday (August 26). The yellow metal strengthened as the US dollar pulled back on news that the Fed is taking a dovish stance that is expected to prolong the current low interest rate environment. The other metals were a mixed bag, with silver on track for second week of gains, benefiting from its dual nature as a precious and industrial metal. In a much-anticipated Thursday address, US Federal Reserve Chair Jerome Powell said the central bank will try to achieve an average inflation level of 2 percent over time, meaning it may be higher or lower than that amount at times. In the hours following, gold rose from US$1,917 an ounce to a five-day high of US$1,966.70. He went on to say his firm expects the currency metal to again test the US$2,000 range, possibly moving as high US$2,300. Silver has been trending higher since pulling back in mid-August. The white metal has now added 10 percent to its value since August 11 and is working towards the US$30 per ounce threshold. Even though silver remains shy of its year-to-date high of US$29.14, achieved on August 10, the present price environment is very supportive of pure-play miners, which according to Metals Focus need a price point of at least US$19 an ounce to be economical. Up 53 percent from January, and more than 100 percent since the March slump, silver is expected to show improved resilience as industrial demand strengthens. Platinum lost some ground mid-week, hitting a monthly low of US$905 per ounce. Early in August, the metal had been approaching US$1,000 territory, but retreated. Despite the recent price pressure, analysts are anticipating a rally later in the year. A release from the World Platinum Investment Council touts increased end-use applications for the metal, with the most prominent being an uptick in use as a coating to prevent corrosion or to boost electroconductivity and heat resistance Palladium faced volatility this session, but still held above US$2,000 an ounce. After steadily moving higher in July, the autocatalyst metal has faced headwinds, shedding 7.1 percent month-over-month. Although prices have slumped in August, the metal is well above its January value of US$1,967 per ounce. Palladium was valued at US$2,601 at 12:10 p.m. EDT on Friday.

The base metals managed to squeak out a gain, with the exception of lead. Climbing as high as US$1,984 per tonne mid-week, subsequent pressures weighed the lead price down. Copper posted a strong gain, starting the session at US$6,579.50 per tonne; it pulled back slightly to end the week at US6,602. The red metal is also benefiting from the Fed’s policy shift and renewed optimism that COVID-19 lockdowns will lead to a smaller demand decline that expected. According to an S&P Global report, copper consumption is now expected to fall by 3 to 4 percent year-on-year, less than a 4.6 percent decline in global GDP. Chinese demand, which accounts for half of the metals market, has been robust and will likely prop the market up in the months ahead. Copper was priced at US$6,602 Friday. Zinc felt resistance this week, pulling the metal off its five-day high US$2,462 per tonne. Prices then settled in the US$2,450 range. Zinc has added 38 percent to its value since January, and Friday saw prices sitting at US$2,455. Nickel hit its year-to-date high this week when it rallied from US$14,862 per tonne to US$1,5120. The surge marks the metal’s best showing since November. Since falling to a low of US$11,055 in mid-March, nickel has climbed 36.7 percent. As of Friday, nickel was valued at US$15,120.

Energy and Oil

Oil prices retreated in the wake of Hurricane Laura, which led to much less destruction than the market had anticipated. That leaves the oil price dynamic little changed from the past two months – WTI and Brent are stuck in familiar territory between $42 and $45. The concentration of energy assets along the Texas and Louisiana coast more or less avoided the worst-case scenario from Hurricane Laura. “The damage is not as bad as anticipated, which is creating more sell pressure along the energy complex,” said Phil Flynn, senior market analyst at Price Futures Group. More than 80 percent of oil output in the Gulf of Mexico and almost 3 million barrels a day of refining capacity had been shut ahead of the storm, most of which should come back online fairly quickly. Laura shut-in some LNG operations, and gas exports are set to fall to about 2.1 bcf, the lowest level since February 2019. Oil exports are expected to drop by nearly 1 mb/d this week. Natural gas spot prices rose at most locations this week. The Henry Hub spot price rose from $2.36 per million British thermal units (MMBtu) last week to $2.51/MMBtu this week. At the New York Mercantile Exchange (Nymex), the price of the September 2020 contract increased 3¢, from $2.426/MMBtu last week to $2.461/MMBtu this week. The price of the 12-month strip averaging September 2020 through August 2021 futures contracts declined 1¢/MMBtu to $2.851/MMBtu.

World Markets

European shares rose on further economic stimulus in France and Germany, a recommitment by the U.S. and China to their partial trade deal, and signs of progress in the development of treatments for COVID-19. In local currency terms, the pan-European STOXX Europe 600 Index ended the week 1.02% higher, while Germany’s Xetra DAX Index climbed 2.10%, France’s CAC 40 added 2.18%, and Italy’s FTSE MIB rose 0.74%. The UK’s FTSE 100 Index slipped 0.6%.

Despite renewed surges in coronavirus infections, France, Spain, and Italy appeared to reject the need for nationwide lockdowns to curb what could be a second wave of the pandemic. French Prime Minister Jean Castex said the government would do everything to prevent a nationwide lockdown but warned that some regions might need to be isolated after cases quadrupled over the past month. In Italy, Health Minister Roberto Speranza asserted that the government was optimistic about keeping the situation under control, noting that there were fewer hospitalizations and fatalities. In Spain, Prime Minister Pedro Sanchez appeared to rule out a countrywide lockdown, saying the current outbreak was far from the situation in March and that officials were better prepared and had a better understanding of the virus.

Mainland Chinese stock markets rose for the week. The blue-chip CSI 300 Index gained 2.7% and the benchmark Shanghai Composite Index, which gives a significantly larger weighting to state-owned enterprises, added 0.7%. For the year to date, Chinese yuan-denominated A shares have gained about 10% compared with a roughly 8.5% gain for the S&P 500 Index, making them among the best performers in global stock markets.

The yield on China’s sovereign 10-year bond increased for the week amid further evidence of the strengthening economy. Industrial profits in July surged 19.6% over a year earlier in their fastest year-over-year growth since June 2018. However, cumulative profits for the year to date remain in negative territory. Profits at state-owned enterprises significantly lagged those at private and foreign-owned companies.

The Week Ahead

Important economic data being released this week include Construction Spending, Continuing Jobless Claims, and the PMI Composite.

Key Topics to Watch

  • IHS Markit manufacturing PMI
  • ISM manufacturing index
  • Construction spending
  • Motor vehicle sales (SAAR)
  • ADP employment report
  • Factory orders July                 
  • Initial jobless claims
  • Initial jobless claims
  • Continuing jobless claims
  • Continuing jobless claims
  • Trade deficit
  • Productivity revision
  • Unit labor costs revision
  • Nonfarm payrolls
  • Unemployment rate
  • Average hourly earnings

Markets Index Wrap Up

This image has an empty alt attribute; its file name is markets-week-632x360.jpg
Weekly Market Review – August 22, 2020

Stock Markets

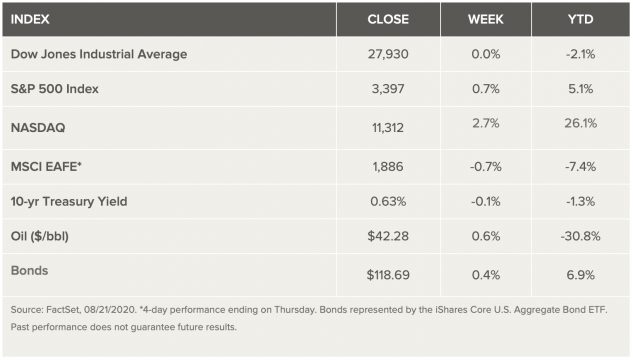
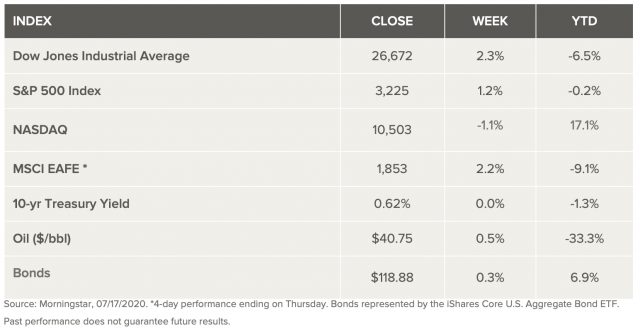
The S&P 500 advanced for the fourth straight week, with technology stocks leading the index to a new record high. Economic data and corporate profits released last week showed that the recovery is progressing, yet it remains uneven. Existing-home sales rose by the most on record in July, boosted by low mortgage rates and low inventory. A few big-box retailers that reported second-quarter results saw profits surge during the pandemic. While these are clear pockets of strength supporting the economy and the market, unemployment remains elevated, highlighting the need for another fiscal package. Analysts contend that an appropriate balance and diversification can help prepare portfolios for any uptick in market volatility while also positioning them for the longer-term recovery.

US Economy

This week the S&P 500 edged passed its pre-pandemic record high reached in February. It was a milestone that marks the roundtrip rally from lows to highs as the fastest bear-market plunge and the second-fastest bear-market recovery in U.S. history. In contrast, the economy has not had a chance to recover as swiftly from the plunge in economic activity in the second quarter as a result of the pandemic and the national and global lockdown measures to contain it. The good news is that after the greatest decline in economic activity since the Great Depression in the second quarter the economy has shown signs of recovery. The bad news is that with COVID-19 cases still at elevated levels, the momentum of that rebound has softened in August.

Metals and Mining

Gold was holding around US$1,930 per ounce on Friday, set to record a second week of declines since breaching the crucial US$2,000 mark. A strong US dollar is pulling the yellow metal back as economic recovery concerns provide tailwinds. The other precious metals also faced pressure this session, but the base metals performed confidently amid positive manufacturing and consumer data. Starting the week at US$1,957, the gold price climbed above US$2,010 on Wednesday. The gain was short-lived, however, as it fell later that day to US$1,927.90. Despite the volatility this session, gold is still on track for a record-setting year. The yellow metal is up 24 percent year-to-date, and gold exchange-traded funds have also registered solid gains in 2020. July marked the eighth straight month of positive inflows — 166 tonnes were added over the month, pushing global holdings to 3,758 tonnes. Although gold is especially attractive in times of uncertainty, the yellow metal has always been the premier long-term investment. Silver’s push towards US$30 per ounce continued this week, with the metal touching US$28.27 on Tuesday. Headwinds mid-session prevented silver from holding its ground, pushing it back below US$27 by the end of the week. Like gold, silver has been on the decline for the last two weeks but is still maintaining broader gains made since January. Year-to-date, the dual metal has added 47 percent to its value. Platinum posted the steepest decline in the precious metals space this week, falling 5 percent since Monday. Decreased jewelry sales resulting from COVID-19, paired with weakened automotive demand, are the primary catalyst behind the decline. The metal’s price has returned to its pre-pandemic range but is still off its year-to-date high of US$1,022 per ounce, set on January 17. After a challenging June and July, the palladium price is holding above US$2,000 an ounce. Since falling to US$1,522 in March, palladium has been unable to maintain the US$2,200 level, although a brief surge at the end of July pushed the automotive metal to US$2,242. Since then, persistent supply chain disruptions and depressed vehicle demand have pulled the metal back to the US$2,000 range.

The copper price spiked early in the week, climbing from US$6,342.50 per tonne to US$6,667. The red metal was unable to maintain the new year-to-date high, pulling back a day later. Zinc made a minor gain this week, edging up from its Monday value of US$2,403 per tonne. Well above its mid-March level of US$1,773, zinc set a year-to-date high this session at US2,466.50. Despite the move, analysts have pointed out that US$2,500 is the resistance level for the metal, and it is currently trading below that. Zinc was selling for US$2,466.50 early on Friday. Nickel also registered a year-to-date high this week, topping US$14,700 per tonne. Unable to maintain the high, its price settled back to US$14,666 on Thursday, and it remained there on Friday. The lead sector also posted an uptick. By mid-week, lead was up 1.94 percent from Monday to US$1,994 per tonne. The move brought the metal closer to its price high for the year, US$2,026 in January. Some of those gains were shed later, and by Thursday lead was back to the US$1,964 range and holding.

Energy and Oil

Oil retreated at the end of the week on more negative news from the U.S. labor market. Oil prices fell back to a familiar trading range in the low-$40s. “With all the bullish headlines that we’ve seen over the last weeks regarding inventories,” the inability to break higher does not bode well, Tariq Zahir, managing member of the global macro program at Tyche Capital Advisors LLC, told the media. “Crude fails to break to the upside and you’re in a contango market, so risk is to the downside.” U.S. oil inventories declined again last week, the fifth time in six weeks. But the process will take a while. OPEC warned that the drawdowns are “slower than anticipated with growing risks of a prolonged wave of COVID-19.” The slow pace underscores the “fragility of the market.” The group of OPEC+ producers that may need to compensate for past overproduction could cut by as much as 2.31 mb/d for one month, according to OPEC+ calculations seen by Reuters. If spread over more than one month, the figure would be smaller.  Natural gas spot price movements were mixed this week. The Henry Hub spot price rose from $2.06 per million British thermal units (MMBtu) last week to $2.36/MMBtu this week. At the New York Mercantile Exchange (Nymex), the price of the September 2020 contract increased 27¢, from $2.152/MMBtu last week to $2.426/MMBtu this week. The price of the 12-month strip averaging September 2020 through August 2021 futures contracts climbed 15¢/MMBtu to $2.866/MMBtu.

World Markets

European shares weakened on worsening U.S.-China relations and growing concerns that a resurgence in coronavirus infections could derail an economic recovery. In local currency terms, the pan-European STOXX Europe 600 Index ended the week 0.81% lower, while Germany’s Xetra DAX Index fell 1.06%, France’s CAC 40 slipped 1.34%, and Italy’s FTSE MIB declined 1.66%. The UK’s FTSE 100 Index shed 1.45%.

The net long position in euro futures climbed to a record level of more than USD 30 billion in the week ended August 11, according to the U.S. Commodity Futures Trading Commission. During the week, the euro reached its highest value relative to the dollar since May 2018, partly on the view that the eurozone economy would recover faster from coronavirus lockdowns than the U.S.

Mainland Chinese stocks ended the week slightly higher as President Donald Trump’s postponement of a six-month trade review assuaged concerns about deteriorating U.S.-China ties. Some observers believe that the White House is seeking more time to allow China to increase purchases of U.S. farm and other exports in order to burnish the optics of the trade deal. However, tensions remained on low boil as the U.S. announced more restrictions on Huawei Technologies, making it difficult for the Chinese telecoms giant to maintain production beyond September without a supply of advanced chips from the U.S. or Taiwan. Longer term, the Trump administration’s actions to restrict the access of Chinese companies to U.S. semiconductor technology will likely remain a source of tension with the U.S. and spur Beijing to foster its domestic technology capabilities.

The Week Ahead

Economic data being released include consumer confidence on Tuesday, durable goods on Wednesday, and personal income and spending on Friday.

Key Topics to Watch

  • Chicago Fed national activity index
  • Case-Shiller national home price index
  • Consumer confidence index
  • New home sales (SAAR)
  • Durable goods orders July
  • Core capital goods orders
  • Initial jobless claims
  • Initial jobless claims (total, NSA)
  • Continuing jobless claims (state program, SA)
  • Continuing jobless claims (total, NSA)
  • GDP revision (SAAR)
  • Pending home sales index
  • Personal income
  • Consumer spending
  • Core inflation  July
  • Advance trade in goods
  • Chicago PMI
  • Consumer sentiment index (final)

Markets Index Wrap Up

Weekly Market Review – August 15, 2020

Stock Markets

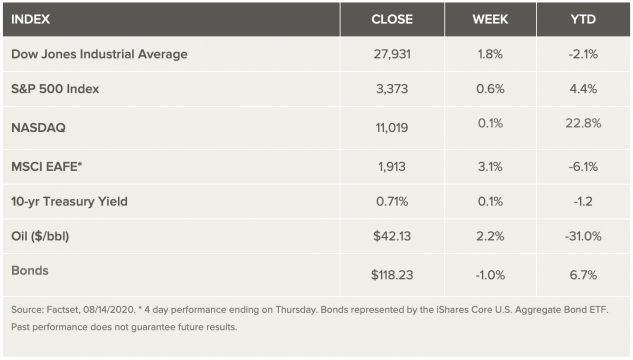
Following another weekly gain, and almost five months after the bear-market low in March, the S&P 500 closed within striking distance of its record high. Even though the pace of improvement is slowing, economic data continue to show steady progress. Initial jobless claims fell below one million for the first time since March, and U.S. retail sales continued to rebound in July, exceeding pre-pandemic levels. As a result of better-than-expected data and an uptick in inflation, government-bond yields hit a two-month high. The lack of progress in the negotiations for another round of fiscal aid represents a growing short-term risk, but fundamentals remain reasonably supportive, according to analysts.

US Economy

Last week the stock market’s impressive run led the S&P 500 within a whisper of its all-time high last seen on February 19.  With the 50% rally from the March lows, equities are now up 4% year-to-date1. While the gains are certainly welcomed by investors, the rebound that has brought the market back near record levels features some interesting dynamics.

If the market officially eclipses February’s high, this will be the second-fastest bear-market recovery in the last half century, trailing only the rapid rebound in 1982. This reflects the unique economic shutdown and reopening aspects of this downturn, which produced the fastest-ever bear-market drop from a market peak, as well as what we expect to be an abnormally short official recession (though also abnormally severe).

The economy is still a long way from regaining its pre-pandemic GDP level, but the stock market’s recovery is a reflection of the forward-looking nature of the stock market. The rally is, analysts say, reflecting an outlook for a continued economic recovery and rebound in corporate profits over the remainder of this year and through 2021.

Metals and Mining

After hitting a new all-time high last week, gold retreated this session and is on track for a 4.2 percent decline. Despite the reversal, the yellow metal is still holding above US$1,940 per ounce. Recent headwinds for the yellow metal come courtesy of a variety of factors, including an uptick in US Treasuries paired with some renewed strength in the US dollar. Positive economic data out of America has also weighed on the broader precious metals sector; the country reported less than 1 million new jobless claims last week for the first time since the pandemic started. The base metals were also challenged over the five-day period, trending lower.

Despite mostly holding above US$1,900, gold recorded its poorest performance since March this week. The decrease ended the currency metal’s nine-week growth trend, but was expected by some. This week’s correction may be short-lived as the US government continues debating another round of stimulus measures, a factor that is likely to impact gold. Silver also pulled back this session, ending nine consecutive weeks of growth. Valued as both a precious and industrial commodity, the white metal was battered on two fronts as both sectors felt pressure. Slipping by 5 percent over five days, silver is still holding in the US$26 per ounce range, which is an important psychological threshold for the metal. Platinum hit its weekly high early on Monday and trended lower for the rest of the week. By Friday the price had shed 3.3 percent Continued demand challenges in the auto sector are preventing the metal from growing, but platinum has regained its March losses and is holding in the range it was at prior to pandemic closures. Palladium has faced similar headwinds as automotive demand is a primary end use of the metal. Prices also spiked early in the week, hitting US$2,167 per ounce. Market volatility set in a day later, sending the price to its weekly low of US$1,942. Since then prices have pulled back above US$2,000.

The base metals sector stalled this week, awaiting the next stimulus move from US Congress, plus the outcome of the US/China phase one trade deal review. Copper was one of the few commodities to squeak out a gain, climbing from US$6,363 per tonne on Monday to US$6,380 on Thursday. According to a Fastmarkets update, Chinese shipments of copper and aluminum have ballooned in recent weeks. That has prompted speculation that the country may be stockpiling ahead of another round of supply disruptions and scrap shortages. Zinc slipped lower this week but has still added 6 percent to its overall value in the last month. The industrial metal is now in range of its year-to-date high of US$2,466 per ounce, set on January 22. Nickel reached its year-to-date high on August 6, when it breached US$14,380 per tonne, taking out the previous high set in late January of US$14,285. Since achieving the milestone in early August, prices faced some pressure this week, impeding new growth. Lead was the only base metal to pull off a sizeable gain. Starting the week at US$1,880 per tonne, its price had climbed 2.7 percent by the week’s end. Despite the move, the lead price is still 4.6 percent off its year-to-date high of US$2,026 set on January 16. The price sat at US$1,932 on Friday.

Energy and Oil

Another week and another snoozer for oil prices. WTI and Brent remain in a narrow range, although their foothold in the $40s feels more solid than it has in the past. EIA data this week showed another decent stock decline, along with an uptick in gasoline demand. The International Energy Agency expects crude oil demand this year to be 8.1 million bpd lower than it was in 2019, a downward demand forecast revision of 140,000 bpd, the authority said in its latest Oil Market Report. The agency cited the very weak aviation industry as a main reason why demand could remain depressed. In the fourth quarter, oil inventories could draw down at “record speed,” according to SEB. “The IEA projected a call-on-OPEC in Q4 2020 of 29.5m bl/day. If this turns out to be correct and OPEC and OPEC+ both stick to their agreed caps, then global inventories will decline by between 4m bl/day and 5.2m bl/day in Q4 2020 – an inventory draw of between 370m bl and 480m barrels in a single quarter, which cannot be far from a historical record,” SEB’s Bjarne Schieldrop said in a statement. Natural gas spot price movements were mixed this week. The Henry Hub spot price fell from $2.18 per million British thermal units (MMBtu) last week to $2.06/MMBtu this week. At the New York Mercantile Exchange (Nymex), the price of the September 2020 contract decreased 4¢, from $2.191/MMBtu last week to $2.152/MMBtu this week. The price of the 12-month strip averaging September 2020 through August 2021 futures contracts remained the same week to week at $2.717/MMBtu.

World Markets

Equities in Europe ended the week higher on signs of progress in developing a vaccine against COVID 19, the disease caused by the coronavirus, and hopes that major economies could pursue additional stimulus measures to bolster a nascent recovery. The strong rally at the start of the week stalled on rising fears of a potential second wave of coronavirus infections in Europe, a risk that prompted the UK to impose more travel restrictions. In local currency terms, the pan-European STOXX Europe 600 Index ended the week 1.24% higher, Germany’s DAX Index rose 1.79%, France’s CAC-40 ticked up 1.50%, and Italy’s FTSE MIB gained 2.62%. The UK’s FTSE 100 Index climbed 0.96%.

Spikes in coronavirus infection rates sparked fears about a second wave in the pandemic. The BBC reported that Germany recorded its biggest daily increase in coronavirus cases in more than three months on Wednesday, while France suffered the biggest daily uptick in positive tests since lifting its lockdown restrictions in May. Spain has the worst infection rate in Europe, with 675 “active outbreaks.” The UK recorded the biggest rise in cases in seven weeks and added France, the Netherlands, and Malta to its quarantine list.

Mainland Chinese stock markets ended the week broadly unchanged as investors stayed on the sidelines ahead of U.S.-China trade talks on August 15. Many analysts see the talks—which are intended to review the progress of the phase one trade deal over the past six months—as a potential risk to markets, though President Trump is believed to want the deal upheld ahead of the November presidential election. However, U.S. import targets for 2020, to which China has committed, already appear out of reach.

In fixed income markets, the yield on China’s 10-year bond was broadly flat following mixed economic data, while the yuan ended largely unchanged against the U.S. dollar. China recently introduced several changes to improve its bond defaults mechanism, though more work needs to be done before domestic credit markets are on par with global standards, according to Asia Times Financial. The first Chinese bond default was in 2014, according to S&P Global Ratings, with 300 technical defaults by 110 companies since then. Just 100 have been resolved so far, mostly by in- and out-of-court restructuring, delayed payment, or liquidation. So far this year, domestic bond defaults have risen 6.6% from a year ago.

The Week Ahead

Economic data being released in the U.S. include building permits on Tuesday, the Federal Reserve’s July meeting minutes on Wednesday, and the leading index on Thursday.

Key Topics to Watch

  • Empire state index
  • NAHB home builders’ index
  • Housing starts July
  • Building permits
  • FOMC minutes           
  • Initial jobless claims (regular state program, SA)
  • Initial jobless claims (total, NSA)
  • Continuing jobless claims (regular state program)   
  • Continuing jobless claims (total, NSA)
  • Philly Fed index
  • Leading economic indicators  July
  • Markit manufacturing PMI (flash)
  • Markit services PMI (flash)
  • Existing home sales

Markets Index Wrap Up

This image has an empty alt attribute; its file name is markets-week-8-15-2020-633x360.jpg
Weekly Market Review – August 8, 2020

Stock Markets

Stocks extended the previous week’s gains, while the Nasdaq set another record on better-than-expected economic data and improved trends in U.S. coronavirus cases. Business activity for the services sectors expanded, and the U.S. economy added 1.76 million jobs in July, beating estimates. The continuing, yet moderating, gains in employment show that the recovery in the labor market and the economy is on track, but there is still a long road ahead.

US Economy

As seen in restaurants and retail stores across the country, change is hard to come by. In fact, the U.S. is experiencing a coin shortage — just another effect of the coronavirus pandemic that has reduced the number of coins in circulation due to dampened consumer spending and limited supply. Coins are not the only form of U.S. currency currently under pressure. Though the U.S. dollar rallied a bit last week from the two-year low reached in late-July, the economic downturn, higher levels of government spending, and near-zero interest rates are likely to continue to push the dollar lower relative to a basket of global currencies.

A path of the U.S. dollar has a mixed effect on the economy. A weak dollar makes imported goods from other countries more expensive for U.S. consumers, but it also makes domestic exports more competitive abroad, which boosts profits for multinational U.S. firms.  With the U.S. dollar being the world’s primary reserve currency, investors pay close attention to it because its path is a key driver of returns across financial markets, from stocks and bonds to commodities and precious metals. Trends in the U.S. dollar also impact interest rates and inflation, shaping what investors can expect from asset returns in the future.

Metals and Mining

Gold’s historic rally continued this week, taking the metal into new record-setting territory. It topped US$2,070 per ounce on Thursday, pulling back overnight as the US dollar gained. The greenback strengthened from a two-year low due to heightened purchases amid growing animosity between Washington and Beijing. Despite the renewed momentum, investors continue to choose safe haven gold as COVID-19 cases increase globally. The yellow metal’s run past US$2,000 marks its ninth straight week of gains. Since March, the price of gold has climbed 36 percent. Silver was also on track for its sixth consecutive week of gains, adding as much as 27 percent to its value. It edged close to US$30 an ounce on Thursday, a seven year high for the white metal. After ending July under price pressure, platinum saw a week of steady gains. Starting the session at US$902 per ounce, the metal moved as high as US$995 before pulling back to US$965. Platinum’s recent price growth is likely linked to tight supply stemming from mine shutdowns and curtailments in H1. An ounce of platinum was valued at US$952.50 as of 11:45 a.m. EDT on Friday. Palladium prices also trended higher this week, fortifying above US$2,000 per ounce. Current supply and demand fundamentals have contributed to palladium’s positive performance, but the metal was already experiencing a prolonged run prior to the pandemic. 2020 mine supply challenges have been less impactful on palladium compared to platinum’s woes. On Friday, palladium was moving for US$1,993.

The base metals also gained broadly, edging higher throughout the week. On Monday, copper was priced at US$6,441 per tonne, a range unseen since April 2019. After slipping to a year-to-date low in March, the red metal has clawed back 39.7 percent. Copper was trading for US$6,453.50 on Friday. Zinc also made gains this period, braking past US$2,300 per tonne for the first time since January. Some of zinc’s growth may be associated to a decrease in Shanghai stocks of the metal, which recorded a 4.4 percent decrease this week amid growing demand. On Friday morning, zinc was priced at US$2,377.50. Nickel has spent the first part of August rocketing higher after a slight slip at the start of the month. On Monday, nickel was sitting at US$13,683 per tonne, but it had climbed 5 percent by Thursday. This week’s gains could be the result of Tesla’s Elon Musk making public calls for more nickel production. The metal is a key component in electric vehicles, a sector where Tesla is a dominant player. To end the week, nickel was selling for US$14,381. Lead also squeezed out a gain this for the first full week of August. Prices faced pressure mid-week, slipping below US$1,860 per tonne. The metal quickly recovered and climbed back above US$1,880; by week’s end, lead was valued at US$1,913.

Energy and Oil

Oil prices rallied to multi-month highs mid-week on stronger EIA data. But the market narrative remains the same – tightening fundamentals set against a weak macro backdrop has kept oil prices stuck in a narrow trading range. On Friday, prices fell back, erasing some gains. Giant BP announced more details earlier this week on how it plans on transitioning into a low carbon energy company, which notably included an expected 40 percent decline in production by 2030, or 1 mb/d. However, the plan apparently relies heavily on selling assets. “It is a simple calculation of natural production decline and planned divestment,” a BP source told media sources. In a securities filing, ExxonMobil said that 20 percent of its oil and gas reserves are at risk of getting wiped off the books because of low oil prices, although the company won’t offer an update until the end of the year. Exxon singled out its Kearl oil sands project in Canada. At least three major Asian refiners are planning to buy less oil from Saudi Aramco in September, potentially a sign of softer demand. In the U.S., shale drillers are not prepared to add rigs back into the field for the remainder of the year and will likely use any increase in cash flow to repair balance sheets rather than return to growth. As a side note, prices of cobalt, a key element in EV batteries, have lately been surging as Covid-19 lockdowns in southern Africa have created severe supply chain bottlenecks. Natural gas spot prices were mixed at most locations this week. The Henry Hub spot price rose from $1.75 per million British thermal units (MMBtu) last week to $2.18/MMBtu this week. At the New York Mercantile Exchange (Nymex), the August 2020 contract expired last week at $1.854/MMBtu. The September 2020 contract price increased to $2.191/MMBtu, up 26¢/MMBtu from last week to this week. The price of the 12-month strip averaging September 2020 through August 2021 futures contracts climbed 9¢/MMBtu to $2.714/MMBtu.

World Markets

European shares rose on signs that an economic recovery may be gaining traction and hopes for more U.S. stimulus. However, escalating tensions between the U.S. and China and fears that Europe could suffer a resurgence of coronavirus cases curbed equity markets’ gains. In local currency terms, the pan-European STOXX Europe 600 Index ended the week 2.03% higher, Germany’s Xetra DAX Index rose 2.94%, France’s CAC 40 gained 2.21%, and Italy’s FTSE MIB climbed 2.22%. The UK’s FTSE 100 Index advanced 2.28%.

Eurozone business activity strengthened in July, signaling the fastest growth rate in two years, according to final data based on surveys. The composite index, which combines manufacturing and services output, rose six points to 54.9. However, firms operated with considerable spare capacity and continued to shrink their headcounts. German industrial production continued to recover in June, rising 8.9% on the month, compared with 7.4% in May. On a year-over-year basis, the country’s industrial output declined 11.5%.

Mainland Chinese markets rallied after data lifted confidence in the economic recovery. The large-cap CSI 300 Index and benchmark Shanghai Composite Index each posted solid gains, even after declining on Friday on news that the Trump administration tightened restrictions on Chinese social media networks TikTok and WeChat in the U.S. In another sign of the growing tech rift between the U.S. and China, San Jose-based video conferencing company Zoom, which gained popularity during the pandemic, said that it would halt direct sales to China and only provide video conferencing services through third-party partners.

The Week Ahead

The second-quarter earnings season will start to wind down with less than 3% of companies in the S&P 500 reporting results. Economic data being released in the U.S. include inflation on Wednesday and retail sales along with consumer sentiment on Friday.

Key Topics to Watch

  • Job openings
  • NFIB small-business index
  • Producer price index             
  • Consumer price index
  • Core CPI
  • Federal budget                                              
  • Initial jobless claims (regular state program, SA)
  • Continuing jobless claims (regular state program, SA)
  • Continuing jobless claims (federal & state, NSA)
  • Import price index                                         
  • Retail sales
  • Retail sales ex-autos
  • Productivity Q2
  • Unit labor costs
  • Industrial production
  • Capacity utilization
  • Consumer sentiment index
  • Business inventories              

Markets Index Wrap Up

Opportunity Zones During Economic Uncertainty

Are you an investor with a recently realized gain? You may want to evaluate the risks and benefits of investing the gain in a Qualified Opportunity Zone (QOZ). Introduced as part of the Tax Cuts and Jobs Act of 2017, opportunity zones offer tax breaks to real estate investors who make long-term investments in low-income census tracks.

The COVID-19 pandemic has left millions sheltered in place, which has subsequently wreaked havoc on the economy. Now, more than ever, investors may want to look towards more long-term investments.

Let’s revisit how the program works and the available tax benefits. After selling an appreciated asset, an investor generally has 180 days to move capital gains into a Qualified Opportunity Fund (QOF). A QOF is an investment vehicle, organized as a corporation or partnership, that holds at least 90 percent of its assets in a Qualified Opportunity Zone Property (QOZP). Generally, QOZP represents a stock or partnership interest in, or a direct investment in, Qualified Opportunity Zone Business Property (QOZBP).

There are three primary tax benefits for investing capital gains into a QOF:

  1. Temporary Deferral on Initial Capital Gains Tax Payment – The capital gains tax owed on the reinvested capital gains is deferred until the QOF investment is sold or exchanged, or until December 31, 2026 (whichever comes first).
  2. Partial Exclusion of Initial Capital Gains Tax Liability – If the QOF investment is held for at least five years, there is a 10 percent exclusion of the deferred capital gain.
  3. Elimination of Future Capital Gains – If the QOF investment is held for at least 10 years, the investor has the potential to eliminate any tax owed on the appreciation of the QOF investment if the QOF investment is subsequently sold.

The program’s proposed regulations created several uncertainties and questions regarding the implementation of the program. After receiving feedback from the public, the U.S. Department of Treasury and Internal Revenue Service issued final regulations. The final regulations are comprehensive in nature and provide clarifications and modifications to the proposed regulations. Some of the key takeaways are as follows:

Eligible Gain

As a general rule, the program only allows deferral of capital gains that are subject to United States federal income tax. Ordinary income, such as money sitting in a savings account, does not qualify. The final regulations outline the type of gains eligible for deferral when reinvested into a QOF within a 180-day reinvestment period.  The 180-day reinvestment timeline for each type of gains is as follows: 

  • Sales of business property: Gross Section 1231 gains for business or trade property held for more than one year (other than those recaptured and treated as ordinary income) can be invested in a QOF without regard to losses. The 180-day reinvestment timeframe begins on the date of the sale or exchange as opposed to the last day of the taxable year.
  • Installment sales: Gains from installment sales can be reinvested beginning on either the last day of the taxable year in which the gain would ordinarily be recognized or the date each payment is received. As a result, a taxpayer who receives multiple payments throughout the year may elect to have multiple, separate 180-day reinvestment timeframes.
  • Foreign investments: Non-resident aliens and foreign corporations can invest capital gains that are effectively connected to a U.S. trade or business. This includes gains on real estate assets that are taxed to non-residents and foreign corporations under the Foreign Investment in Real Property Tax Act (FIRPTA) rules.
  • Pass-Through Entities: Partners in a partnership, shareholders of an S Corporation, and beneficiaries of estates and non-grantor trusts have the option to start the 180-day reinvestment timeframe on the same day as the entity’s 180-day reinvestment timeframe, the last day of the entity’s taxable year, or the due date of the entity’s tax return (without extension) for the taxable year of the gain.
  • Regulated Investment Company (RIC) and Real Estate Investment Trust (REIT): The 180-day reinvestment timeframe begins at the end of the taxable year in which capital gain dividends would otherwise be recognized by the shareholder. However, the shareholder may elect to instead begin the 180-day period upon receipt of capital gains dividends from a RIC or REIT.

Inclusion Events

Any gain arising from an inclusion event (i.e., events that reduce direct equity interest in a QOF), such as the termination or change in classification of a QOF’s status or transfer by gift or divorce, is eligible for deferral into a new QOF. The inclusion event can represent all or only a portion of the initially deferred gain. The 180-day timeframe begins on the date of the inclusion event. A full list of events and additional rules can be found in the final regulations. 

“Sin Business” Narrowly Permitted

The final regulations allow a QOZB to lease up to 5 percent of its property to any of the prohibited sin businesses, which include golf courses, country clubs, massage parlors, hot tub facilities, tanning salons, racetracks, gambling facilities, and liquor stores. However, a QOZB may not engage directly in any of such sin businesses.

Original Use of Tangible Property

Original use commences when a QOF or QOZB places into service property in a QOZ for purposes of depreciation or amortization. For instance, a QOF that purchases raw land and constructs a new multi-family building can pass the original use test because there was no prior economic use for the land or materials. The final regulations include the following exceptions:

  • Self-constructed: Tangible property manufactured, constructed or produced (rather than purchased) by a QOF or QOZB may qualify as QOZBP as long as construction occurred after December 31, 2017 with the intent to use it in a QOZ. Also, the materials, construction and production must all be considered zone business property.
  • Vacant property: Property that has been vacant for one year may qualify as original use, but only if the property was vacant for one year prior to the designation of the QOZ and remains vacant through the date of purchase. Property that does not meet this requirement will qualify after three years. Furthermore, the final regulations define “vacant” property as “significantly unused,” or more than 80 percent of the building or land is not being used.
  • Brownfield sites: The land and structures qualify as original use property as long as the QOF or QOZB invest enough to improve the safety standards for human health and the environment.
  • Leased property: A lease between unrelated parties is generally presumed to be a market-rate release. State and local governments, as well as Indian tribal governments, will be exempt from market-rate requirements.

If the property is not original use and does not meet the above exceptions, it must be substantially improved in order to qualify.

Substantial Improvement Test

The final regulations modified the substantial improvement testing to mitigate the asset-by-asset approach in the proposed regulations. The following aggregation methods were added:

  • Aggregation of property: QOFs and QOZBs are permitted to incorporate the cost of purchased original use assets that would otherwise qualify as QOZBP. The property must be located in the same QOZ and used in the same trade or business. It must also improve the functionality of non-original use of the property. For example, if a QOF intends to substantially improve a hotel, it may incorporate mattresses, bed frames, linens and other tangible property utilized in the hotel business.
  • Aggregation of buildings: Two or more buildings within a single QOZ, or a series of abutting QOZs that are located on land described in a single deed, may be treated as single property for purposes of the substantial improvement test.

Safe Harbors

The final regulations offer additional rules and expansions of previous safe harbors:

  • 50 percent gross income: A QOZB is required to derive at least 50 percent of its total gross income from the active conduct of a trade or business within the QOZ. The 50 percent active conduct requirement is quantified with the addition of three safe harbors: (1) contractor or employee hours; (2) the amount of payments for services; and (3) gross income.
  • Working capital safe harbor: The proposed regulations incorporated a safe harbor permitting a QOZB that acquired, constructed or substantially improved a QOZBP to treat cash or cash equivalents (with a term of 18 months or less) as a reasonable amount of working capital for up to 31 months. The final regulations provide the property may benefit from an additional 31-month safe harbor, for a maximum of 62 months. To qualify for the 62-month safe harbor, the QOZB must receive multiple cash contributions and each contribution must be allocated in a 31-month spending plan. If government delays (i.e., approval of building permits, zoning changes, etc.) interfere with the spending plan, the time is halted until the delay is resolved. Also, a QOZB may receive an additional 24 months if it is located in a zone identified as a disaster area.
  • QOF 90 percent testing: A QOF must ensure that at least 90 percent of its assets are invested in the stock or partnership interest of a QOZB or invested directly into a QOZP. A measurement of assets must be conducted semi-annually, on the last day of the first six-month period (June 30) and the last day of the taxable year of the QOF (December 31), or the QOF will incur a penalty. Prior to the final regulations, investors questioned the possibility of meeting the testing requirements, especially given shifting assets and the varied taxable years of businesses. Under the final regulations, a business only needs to be considered a QOZB at the end of its respective tax year. Even if the business fails the test, it can take advantage of a one-time 6-month cure period.

10-Year Exit

The final regulations allow investors that hold QOF investments for at least 10 years to elect to exclude all gain from the sale of QOF, QOZB interests, and, most significantly, from assets held by QOZB partnerships and S corporations with the exception of inventory sold in the ordinary course of business.

For more information about the opportunity zone program, visit the U.S. Treasury Department’s Opportunity Zone Resources web page.

Opportunity Zone Investing: Is it right for you?

Investments in the opportunity zone program aren’t just about seeking tax benefits – the guiding principle of the program is to bring much-needed investment capital to historically low-income communities and provide revitalization with a lasting impact.  If you’re looking to participate, it’s best to read the final regulations in their entirety and consult with investment and tax professionals and to consider the risks and benefits.

When you’re ready to close on a deal, Ideal Title can help. They have the professionals to assist investors with their title and escrow needs. To find out what title insurance and closing services options are available, contact Ideal Title Agency at info@idealtitleagency.com or check them out on Facebook: facebook.com/idealtitle .

Weekly Market Review – August 1, 2020

Stock Markets

GDP growth data was released last week, showing the sharpest quarterly downturn on record, driven by shutdown policies aimed at combatting the spread of the coronavirus. The negative GDP growth, however, was better than expected, with stocks finishing the week slightly higher on positive earnings news. Big tech held the earnings spotlight, with three big tech names (Facebook, Amazon, and Apple) reporting results that were significantly better than expected. Congressional negotiations over a fifth coronavirus relief bill were stalled as Democrats and Republicans struggle to reach terms.

US Economy

Stocks escaped a busy week of earnings, economic data reports, and the Federal Reserve’s (Fed) policy meeting unscathed, finishing modestly higher and adding to the biggest four-month gain in the S&P 500 since 2009. At the same time, nervousness about the negotiations over the next round of fiscal relief, along with concerns about the sustainability of the rebound, pushed the 10-year yield to its third-lowest closing level on record and the five-year yield to a new record low.

Nevertheless, a fresh look at the three underpinnings of long-term investment returns – the economy, earnings, and monetary policy – reveals that the fundamental backdrop, while fragile, is trending in the right direction, according to analysts. A rebound in economic activity and corporate earnings, along with ongoing monetary-policy stimulus, should provide broad support, but virus concerns and political uncertainties are likely to spark bouts of volatility along the way.

Metals and Mining

Gold continued to trend higher this week breaking its previous all-time high. A weak US dollar and a steady uptick in America’s new COVID-19 cases sent investors to safe havens, ultimately benefiting gold and silver. Poor economic data is painting a bleak picture for economic recovery as many analysts begin to realize the rumored V-shaped recovery will not materialize. The yellow metal started the session firmly planted above US$1,900 per ounce. By mid-week the metal had reached US$1,970 and was still strengthening. Silver also performed positively this week, reaching price territory unseen since 2013. The white metal moved from its Monday start price of US$24.10 per ounce to a seven-year high of US$25.89, prompting many to speculate how high the metal will go. As industrial demand has shrunk, exchange traded fund demand has helped the metal add to its value during the first half of 2020. Platinum faced some challenges this session, which weighed on its ability to lock in gains. A brief mid-week rally saw the price top US$951 per ounce. However, the price faced pressure from declining consumer demand in the auto sector and pulled back. The palladium story was similar this week, as the weakened auto sector continues to grapple with a host of transport and logistical issues. A mid-week high of US$2,2267 per ounce brought the metal back to pre-pandemic levels. The rally then reversed as the price fell below US$2,000. Despite weak economic information from America, copper was able to hold above US$6,400 per tonne this session. The price has continued to strengthen over the last three months thanks to improved demand from China.

Zinc edged higher this week to a six-month despite surplus levels rising at the London Metals Exchange warehouse. The stockpile may weigh on prices later in the quarter, however for now investors continue to believe in the sector. Zinc was valued at US$2,275 per tonne on Friday. Nickel prices continue to fell pressure. A 1.8 percent price slip mid-week brought the metal to US$13,470 per tonne. Lead made some minor gains over the five-day period. Despite edging higher lead is still 18.7 percent off its year-to-date high of US$2,265 per tonne and expected to face continued headwinds from the demand side.

Energy and Oil

Oil prices retreated on Thursday after the U.S. posted a horrific second quarter GDP figure. Prices steadied in early trading on Friday, pushing crude benchmarks back to familiar territory – roughly $40 for WTI and $43 for Brent.  ExxonMobil reported a loss of nearly $1.1 billion, the largest quarterly loss in 36 years. Production was down 7 percent, year-on-year. Exxon said its working on cost-cutting plans in a “last ditch” effort to preserve its dividend. and CEO Darren Woods said that the company would not take on more debt. Chevron reported an adjusted loss of $3 billion, along with an impairment of $5.6 billion. That included writing off Chevron’s entire unit in Venezuela, worth about $2.6 billion. “We would need to see sustained economic recovery and much lower inventory levels before we would add capital back to the Permian or other basins,” Pierre Breber, Chevron’s finance chief, told the media. “We’re in a lower for longer world where demand is down and there’s ample supply.” Across the border, Canada is on track to drill 2,800 wells this year, according to the Petroleum Services Association, the third downward revision for the group. Last year, the industry drilled 4,900 wells. Natural gas spot prices rose at most locations this week. The Henry Hub spot price rose from a low of $1.64 per million British thermal units (MMBtu) last week to $1.75/MMBtu this week. At the New York Mercantile Exchange (Nymex), the August 2020 contract expired Thursday at $1.854/MMBtu, up 17¢/MMBtu from last week. The September 2020 contract price increased to $1.930/MMBtu, up 21¢/MMBtu from last week to this week. The price of the 12-month strip averaging September 2020 through August 2021 futures contracts climbed 18¢/MMBtu to $2.620/MMBtu.

World Markets

Equities in Europe fell on concerns about an economic recovery due to a resurgence in coronavirus infections, U.S.-China tensions, and disappointing company earnings. In local currency terms, the pan-European STOXX Europe 600 Index ended the week about 3.0% lower, Germany’s DAX Index fell 4.1%, and France’s CAC 40 slid 3.5%. The UK’s FTSE 100 Index dropped 3.7%.

European corporate earnings were generally downbeat in the second quarter, especially for banks. In energy, Royal Dutch Shell and Total proved resilient as strong oil trading revenues helped offset falling energy demand triggered by the pandemic. In autos, results from Volkswagen and Renault disappointed.

The German and French economies slumped in the second quarter as household spending, business investment, and exports collapsed during the coronavirus pandemic, according to preliminary data. Germany’s GDP shrank by a record 10.1% quarter on quarter, and in France, where restrictions were stricter, the economy contracted 13.8%.

In China, mainland equity markets rallied on positive data despite elevated U.S.-China tensions and floods in the country’s Yangtze River basin. The large-cap CSI 300 Index rose 4.2%, and the benchmark Shanghai Composite Index gained 3.5%, reversing the previous week’s declines. A-share funds suffered outflows during the week after a correction the previous Friday, with institutional outflows outweighing retail investor inflows. Northbound Stock Connect (investments in mainland stocks by Hong Kong-based foreign investors) saw significant net outflows, especially in financial stocks.

The Week Ahead

Important data being released next week include construction spending, the unemployment rate, the Purchasing Managers’ Index (PMI) composite, and consumer credit.

Key Topics to Watch

  • Markit manufacturing PMI
  • ISM manufacturing index
  • Construction spending
  • Motor vehicle sales   
  • Factory orders June
  • ADP employment report
  • Trade deficit
  • Treasury quarterly refunding                                    
  • Markit services PMI
  • ISM nonmanufacturing index July     
  • Initial jobless claims (state program, SA)
  • Initial jobless claims (total, NSA)
  • Continuing jobless claims (state program, SA)
  • Continuing jobless claims (total, NSA)
  • Household debt (SAAR)                                             
  • Nonfarm payrolls
  • Unemployment rate
  • Average hourly earnings
  • Wholesale inventories
  • Consumer credit

Markets Index Wrap Up

This image has an empty alt attribute; its file name is marketsweekly-8-1-2020-634x360.jpg
Weekly Market Review – July 25, 2020

Stock Markets

Stocks declined modestly last week, while long-term bond yields retreated near record lows. The S&P 500 turned briefly positive for 2020 before pulling back on concerns over escalating Chinese/American tensions. On the economic front, U.S. initial jobless claims increased last week for the first time since March, raising worries that the economic recovery is beginning to stall. Positively, European Union leaders agreed on a landmark stimulus package to help member states mitigate the economic downturn. Analysts believe the pace of improvement in economic data will likely slow as coronavirus cases continue to rise, but the continuing fiscal and monetary stimulus will play a crucial role in supporting the expansion until a vaccine is discovered.

US Economy

In response to the coronavirus-tainted reopening of the U.S. economy, legislators also met in D.C. this week to negotiate a new round of stimulus. Federal stimulus has been a strong support for stocks to climb during the rally from the March 23 lows, despite near-term economic challenges. However, key relief measures to households will expire at the end of July, which could slow the overall economic recovery.

In contrast to the struggling labor market, the housing market is showing itself to be a bright spot in the economy. Existing home sales increased 20.7%, and new home sales rose by 13.8% in June versus the previous month. After stalling earlier this year as stay-at-home orders were put in place nationally, record-low mortgage rates have lured homebuyers back into the market. Thirty-year mortgage rates have fallen from low to lower this year, dropping from 3.7% in January to 3% last week.  Housing, as one of the most interest-rate-sensitive sectors of the economy, is an important watchpoint for markets, serving as both a current indicator of consumer health and a leading indicator of economic recovery.

Metals and Mining

Gold broke past the US$1,900 per ounce mark this week, driven by a weakening US dollar and mounting safe haven demand. Climbing as high as US$1,905 on Friday morning, the yellow metal has added more than 5 percent to its value since Monday. Its ascent has not yet taken it past its previous high of around US$1,920, set in September 2011. Silver also had a stellar performance, adding 16 percent this week and holding above US$22 an ounce. Much of golds price growth over the last four months has resulted from the economic upset caused by COVID-19. Mass money printing, quantitative easing and stimulus have all made gold more alluring as the US dollar becomes increasingly devalued. As mentioned, silver has made significant gains, climbing from US$19.59 on Monday to US$22.84. The white metal’s price growth this week marks its best performance in almost three decades. Silver is now at seven-year highs, and its safe haven characteristics have made exchange-traded funds increasingly appealing. All-time yearly inflows were surpassed in the first half of 2020. Platinum was also in the positive this week. Monday saw the metal trading in the US$842 per ounce range, steadily edging higher. The metal’s weekly high came mid-week, when it hit US$923. Shedding some of that growth later in the week, platinum is still shy of its year-to-date high of US$1,022, set in mid-January. Breaking past US$2,000 an ounce, palladium added more than 6 percent to its price this week. Weak industrial demand has been offset by rising COVID-19 numbers out of South Africa, a primary producer of both platinum and palladium.

The base metals space also saw broad increases, with the exception of lead, which fell lower. Copper made firm gains, climbing above US$6,500. The red metal hit a year-to-date high last week before retreating; it is now within range of surpassing US$6,545. Zinc made more modest gains, adding 1.6 percent over the week. The metal is still well off its year-to-date high but is in price territory similar to February. Zinc was priced at US$2,207 on Friday morning. Nickel prices continue to gain support from supply chain woes. This week saw the metal add 2 percent to its value as it continues to move away earlier lows. Nickel ended the session trading for US$13,460 per tonne. Lead was the only base metal to slip lower this week. Despite the modest price shedding, the metal is now in its pre-pandemic price range. But is still over US$200 off its January high of US$2,026.

Energy and Oil

Oil fell back to around $40 for WTI and $43 for Brent – familiar territory for the market over the past few weeks. The EIA’s data for this week was more downbeat, dashing hopes of positive momentum. Still, crude remains stable and steady at around $40, trapped between coronavirus fears on the downside, and improving fundamentals on the upside. The Chevron purchase of Noble Energy may spark more M&A activity. Goldman Sachs said more M&A could be positive for the macro outlook for oil because consolidation will translate into slower production growth. “We believe strip prices are too low and are likely to move higher in 2021, a catalyst not only for fundamental upside to E&P stocks but also for potential M&A values,” Goldman Sachs said in a note. New York is seeking bids for 2.5 GW of offshore wind and 1.5 GW of onshore renewables. The state will also invest $400 million in port upgrades to support offshore wind. Meanwhile, Saudi Arabia is accelerating plans to sell off state assets and is considering an income tax in order to shore up its budget. Schlumberger, the largest oilfield services company in the world, said it would eliminate 21,000 jobs. The company posted a loss of $3.4 billion in the second quarter, including a $3.7 billion-dollar impairment. Natural gas spot prices fell at most locations this week.

The Henry Hub spot price fell from $1.71 per million British thermal units (MMBtu) last week to $1.64/MMBtu to this week. At the New York Mercantile Exchange (Nymex), the price of the August 2020 contract decreased nearly 10¢, from $1.778/MMBtu last week to $1.681/MMBtu this week. The price of the 12-month strip averaging August 2020 through July 2021 futures contracts declined 5¢/MMBtu to $2.371/MMBtu.

World Markets

European shares fell, as a deterioration in U.S.-China relations eroded earlier gains from the European Union (EU) agreeing on a recovery fund and positive news on efforts to develop a coronavirus vaccine. In local-currency terms, the pan-European STOXX Europe 600 Index ended the week 1.17% lower, while Germany’s DAX Index eased 0.23%, France’s CAC 40 slid 1.47%, and Italy’s FTSE MIB declined 1.25%. The UK’s FTSE 100 Index fell 2.38%.

Business activity in the eurozone grew in July for the first time since February and at the fastest rate in more than two years, a survey by IHS Markit showed. The Flash Eurozone PMI Composite Output Index rose to 54.8—well above 50, the level that divides expansion from contraction, and the 48.5 reading registered in June. Both manufacturing and services portions of the economy returned to growth. New order inflows picked up and job losses eased, although job cutting was widespread as many companies continued to reduce capacity.

Mainland Chinese stocks declined for the week. The large-cap CSI 300 Index declined 0.9% and the benchmark Shanghai Composite Index shed 0.5%, weighed by a Friday sell-off on news that the Trump administration withdrew consent for China to operate its consulate in Houston, Texas. This unexpected decision rattled investors who viewed it as an aggressive move that would ratchet up bilateral tensions at a time when China’s economic recovery remains fragile.

In China’s bond markets, the yield on the sovereign 10-year bond ended the week almost unchanged at 2.98%. The People’s Bank of China kept the loan prime rate (LPR), a reference rate for new bank loans, unchanged for a third straight month, as expected. The one-year LPR remains at 3.85%, while the five-year rate stands at 4.65%. In the currency markets, the renminbi declined following the escalation in U.S.-Beijing tensions, losing 0.4% against the greenback and closing at 7.018 for the week.

The Week Ahead

The earnings season will take center stage, with almost 40% of the S&P 500 companies reporting second-quarter results. Important economic data being released include consumer confidence on Tuesday, the Federal Reserve’s interest rate decision on Wednesday, and the preliminary second-quarter GDP on Thursday.

Key Topics to Watch

  • Durable goods orders June
  • Core capital goods orders                              
  • Case-Shiller national home price index (year-over-year)
  • Consumer confidence index
  • Homeownership rate Q2      
  • Advance trade in goods
  • Pending home sales index                                             
  • GDP Q2
  • Initial jobless claims (regular state program)
  • Continuing jobless claims (regular state program)
  • Continuing jobless claims (total, NSA)
  • Personal income
  • Consumer spending
  • Core inflation  June
  • Employment cost index
  • Chicago PMI
  • Consumer sentiment index

Markets Index Wrap Up

Weekly Market Review – July 18, 2020

Stock Markets

Stocks finished higher for the third consecutive week on coronavirus-vaccine optimism and positive economic data. U.S. retail sales jumped 7.5% in June, and industrial production increased the most since 1959, both surprising to the upside. Following a two-month rebound, retail sales are almost back to their pre-virus levels, largely helped by the direct support and fiscal transfers from the government to consumers. As the expanded unemployment benefits are due to expire at the end of the month, expectations are that Congress will manage to reach a deal on a new aid package, which is much needed to support the economic recovery.

US Economy

As the economy takes the first tentative steps out of a deep but likely short recession, the destination is clear for many investors. After a precipitous decline in economic activity in the second quarter (the worse since the Great Depression), the economy is set to rebound faster than in previous recessions on the tailwinds of pent-up consumer demand and an unprecedented amount of fiscal and monetary stimulus. Widespread agreement that economic and corporate fundamentals are headed to a more encouraging destination has helped stocks climb 40% from the March low and within 5% of the February high down just 0.5% for the year.

However, the journey to a recovery is likely to be stalled at times by occasional setbacks due to the unpredictable path of the coronavirus pandemic. Despite a fast-initial acceleration, the economy faces headwinds borne out by the dogged virus, which have led to new outbreaks in the Southern and Southwestern regions of the U.S. All told, the trek back to pre-pandemic levels of economic output is likely to be protracted and potholed, with the CBO estimating a nine-year stretch before the economy recovers completely from the pandemic.

Metals and Mining

The gold price held above US$1,800 per ounce this week. Starting the period at US$1,806, the yellow metal briefly slipped to US$1,795 before climbing back above the US$1,800 threshold. Rising COVID-19 cases in gold production hub South Africa, paired with massive upticks in the US, have been price growth catalysts as investors move toward the inflationary hedge and safe haven asset. As of Friday, there were 13.8 million COVID-19 cases globally and 591,000 deaths worldwide related to the virus. Moving as high as US$1,813 on Wednesday, gold has now added more than 20 percent to its value since falling to US$1,498 in March. It is on its way to a sixth week of gains. As the long-term impacts of the pandemic begin to emerge, market watchers are forecasting more stimulus and bailouts, which will ultimately bolster the case for gold. Silver has also been on a steady upward trajectory since mid-June, holding above US$19 per ounce. Now approaching four-year highs, the white metal is also poised to benefit from the mounting financial uncertainty related to COVID-19. As silver and gold moved higher, platinum was challenged and fell lower. Starting the trading week at US$839 per ounce, the metal trended down to a low of US$812. Palladium sat in the US$1,900 per ounce range, surging to US$1,993 on Monday. The metal dropped to US$1,885 hours later before ticking higher in the days to follow. Continued pressure on auto demand is seen weighing on palladium’s ability to reach its early March level of around US$2,400.

As the precious metals held steady, base metals faced headwinds, ending the week lower. Concern that a second wave of COVID-19 will lead to new lockdowns prevented the space from locking in gains. Copper had fallen 2.4 percent by Thursday to reach US$6,385 per tonne, down from the US$6,545 level seen on Monday. Despite that poor showing, the red metal has been a top performer in the base metals sector this year, growing 6 percent on the London Metal Exchange year-to-date. Zinc also started the session at its high, slipping lower over the week. Delayed concentrate shipments this year are expected to put the metal in surplus in 2021. Shedding 1.7 percent from its value, nickel spent the early part of the week climbing higher. Reaching US$13,512 per tonne on Wednesday, the metal slipped 1.9 percent Friday. Despite the fall late in the week, nickel’s H1 performance was surprisingly positive. Nickel’s resilience has prompted Fastmarkets analysts to slightly increase their outlook. Supply chain interruptions in the first half of the year and concerns about future lockdowns have benefited lead prices broadly, despite the metal trending lower this session. Holding in the US$1,800 per tonne range, the metal is now within range of its January highs.

Energy and Oil

The big oil market news of the week was the easing of cuts from OPEC+. The markets largely welcomed the move, especially since it included pledges by laggards to temporarily keep some supply off of the market to compensate for past under-compliance. Meanwhile, bullish EIA data also boosted sentiment. However, by the end of the week, concerns about slowing oil demand weighed on prices, keeping them stuck at around $40. OPEC+ cut really deep in June, and the cohesion was maintained as the group moved to ease production cuts from 9.7 mb/d to 7.7 mb/d in August. However, the headline number is mitigated by the fact that the so-called laggards are supposed to “compensate” for overproducing in recent months. So, the effective production cuts may only decline to 8.1 to 8.3 mb/d in August instead of 7.7 mb/d. Analysts mostly think that there is room for OPEC+ to increase production without leading to a slide in prices. After all, demand apparently outstrips supply at the moment. Saudi Arabia’s Energy Minister Prince Abdulaziz bin Salman said the increase will be “barely felt.” Still, significant downside risk remains, largely revolving around the potential hit to demand from the coronavirus and renewed closures. U.S. gasoline demand fell 5 percent last week, the second consecutive week of declines. “Normally this two-week period would have been the peak demand period and we didn’t get it,” said John Kilduff, partner at Again Capital in New York. “The recovery has been unwinding.” Natural gas spot prices fell at most locations this week. The Henry Hub spot price fell from $1.79 per million British thermal units (MMBtu) last week to $1.71/MMBtu this week. At the New York Mercantile Exchange (Nymex), the price of the August 2020 contract decreased 5¢, from $1.824/MMBtu last week to $1.778/MMBtu this week. The price of the 12-month strip averaging August 2020 through July 2021 futures contracts declined 2¢/MMBtu to $2.421/MMBtu.

World Markets

European shares rose over the week on reports of progress in the development of a coronavirus vaccine. The pan-European STOXX Europe 600 Index ended the week 1.6% higher. The major country indexes also climbed, with Germany’s Xetra DAX up 2.26%, France’s CAC 40 1.99% higher, and Italy’s FTSE MIB ahead by 3.24%. The UK’s FTSE 100 Index added 3%.

European Union (EU) leaders started a two-day summit Friday to discuss the proposed EUR 750 billion EU recovery fund, amid market hopes for a deal by the end of summer. The size of the fund, distribution criteria, and the proportion of grants to loans are the main areas of disagreement. The Netherlands, Sweden, Denmark, and Austria want to link loans to reforms designed to boost productivity and jobs. Italy and Spain, which were hit hard by the coronavirus, seek a simplified reform agenda and distribution of funds via grants.

Chinese stocks slumped in a volatile trading week amid indications of economic weakness, renewed U.S. trade tensions, and profit taking following recent gains. The large-cap CSI 300 Index fell 4.4%, its biggest weekly decline since February, while the country’s benchmark Shanghai Composite Index lost 5.0%. China’s sovereign 10-year bond yield declined by nine basis points to 3.04% on the week through Friday.

China’s economy grew a better-than-expected 3.2% in the second quarter from a year earlier, reversing a historic 6.8% contraction in the first quarter, according to preliminary data from the country’s statistics bureau. On a sequential basis, gross domestic product rebounded by a rate of 11.5% quarter on quarter, following a 10.0% drop in the first quarter. In the release accompanying the data, China’s National Bureau of Statistics warned that “we should be aware that some indicators are still in decline and the losses caused by the epidemic need to be recovered.”       

The Week Ahead

The earnings season will take center stage, with about 20% of the S&P 500 companies reporting second-quarter results. Important economic data being released include existing home sales on Wednesday, the leading economic index on Thursday, and July’s preliminary Purchasing Managers’ Index on Friday.

Key Topics to Watch

  • Chicago Fed national activity index
  • Committee vote on Fed nominations of Judy Shelton, Christopher Waller             
  • Existing home sales (SAAR)
  • Initial jobless claims (regular state program)
  • Continuing jobless claims (regular state program)
  • Continuing jobless claims (federal & state, NSA)
  • Leading economic indicators  June    
  • Markit manufacturing PMI (flash)
  • Markit services PMI (flash)
  • New home sales (SAAR)                                            

Markets Index Wrap Up

This image has an empty alt attribute; its file name is markets-week-7-18-2020-640x332.jpg
error: Content is protected !!