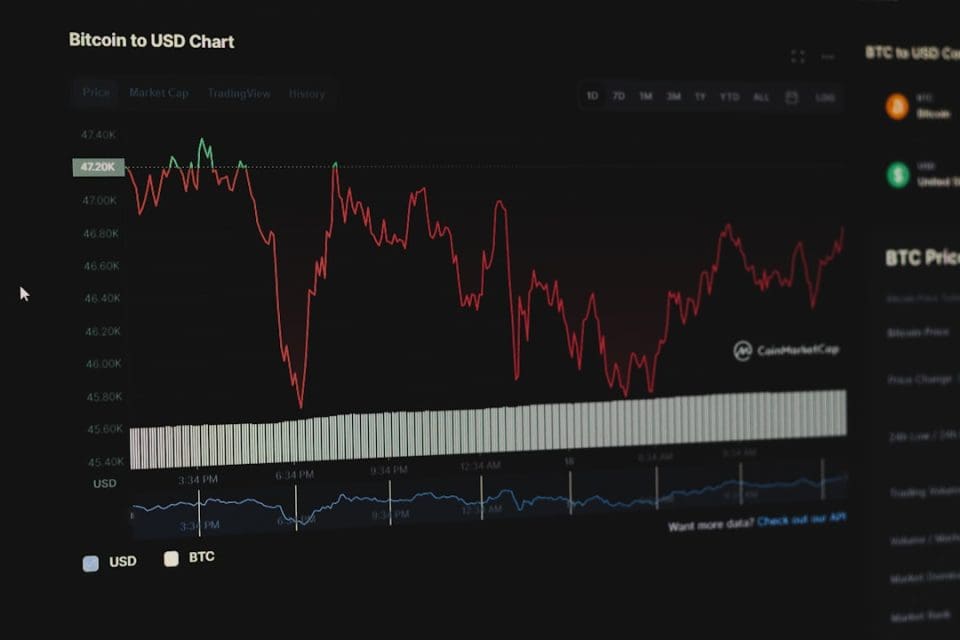
The Signal Traders Are Watching: Stock Screener Breakout Patterns Setting Up a Major Equity Move
Something is happening beneath the surface of equity markets that seasoned traders are not ignoring. Across multiple sectors, a growing cluster of stocks is flashing identical technical signals — the kind that…

Something is happening beneath the surface of equity markets that seasoned traders are not ignoring. Across multiple sectors, a growing cluster of stocks is flashing identical technical signals — the kind that historically precede significant price acceleration. At the center of this activity is the stock screener breakout, a tool-driven approach that is helping both institutional and retail traders identify momentum before it becomes mainstream news.
This is not a coincidence or noise. When screener data begins aggregating similar setups across dozens of tickers simultaneously, it signals a structural shift in market behavior — one that warrants serious attention from anyone actively managing a portfolio.
What a Stock Screener Breakout Actually Reveals About Market Structure
A stock screener breakout occurs when a security clears a defined technical threshold — typically resistance levels, moving average crossovers, or volume-confirmed price breaks — that a screener has been set to flag. What makes this moment powerful is not the individual stock, but what it says about broader market participation.
When screeners begin returning large batches of breakout candidates simultaneously, it often indicates that institutional capital is rotating aggressively into equities. Unlike retail-driven rallies that tend to be narrow and volatile, institutional rotation produces cleaner breakouts with sustained follow-through. The screener essentially acts as a diagnostic tool, revealing where conviction and capital are converging.
Traders using platforms like Finviz, Trade Ideas, or ThinkorSwim have been noting an unusual density of setups across technology, industrials, and select energy names. These are not random alerts — they represent a compressing market environment where price has consolidated for weeks, and the pressure is building for a decisive directional move.
The Technical Criteria That Define High-Probability Breakout Setups
Not every alert from a screener represents a genuine opportunity. The difference between a false breakout and one with real follow-through comes down to filtering precision. Traders who consistently profit from the stock screener breakout methodology apply a layered set of criteria before entering a position.
- Volume confirmation: A valid breakout should occur on volume at least 1.5 to 2 times the 20-day average. Volume is the fuel that separates a real move from a head fake.
- Relative strength: The stock should be outperforming its sector peers in the days leading up to the breakout, indicating accumulation is already underway.
- Consolidation pattern: The tightest, most actionable setups emerge from stocks that have been in a narrow range for three to six weeks — the longer the base, the more powerful the potential move.
- Market context: Breakouts that occur when the broader index is in an uptrend carry dramatically higher success rates than those attempted in a choppy or bearish environment.
The difference between a false breakout and one with real follow-through comes down to filtering precision.
Filtering for all four of these elements simultaneously is where a well-configured stock screener earns its value. The goal is not to find every breakout — it is to find the ones worth trading.
Sector Rotation and the Breakout Clusters Appearing Right Now
One of the most telling signs that a major equity move is approaching is the emergence of breakout clusters — multiple stocks within the same sector triggering screener alerts within a short window of time. This is precisely what is being observed across several key market segments.
Technology remains a dominant source of breakout candidates, particularly in the semiconductor and AI infrastructure space, where demand fundamentals continue to support price expansion. Industrials are also generating elevated screener activity, reflecting renewed capital expenditure cycles and nearshoring trends that are providing earnings tailwinds for domestic manufacturers.
Energy, though more cyclical, is producing select breakout setups in the midstream segment, where stable cash flows and rising distribution yields are attracting income-oriented capital. When three distinct sectors begin producing synchronized breakout signals, it is rarely a coincidence — it typically reflects a broader risk-on shift in institutional allocation strategy.
How to Position Ahead of a Major Breakout Move Without Chasing Price
The most common mistake traders make when identifying a stock screener breakout is entering too late — after the move has already accelerated and risk-reward has deteriorated. Disciplined execution means identifying the setup before the breakout, not after it has already become obvious.
Effective positioning involves watching stocks that are building the right technical structure and placing conditional orders just above resistance. This removes emotional decision-making from the equation. Setting a stop-loss at the base of the consolidation pattern protects capital if the breakout fails, while allowing meaningful upside if the move confirms.
Position sizing also matters enormously. Concentrating too heavily in a single breakout candidate undermines the statistical edge that screener-based strategies are built on. Spreading exposure across three to five high-quality setups captures the aggregate probability of the approach rather than betting everything on a single outcome.
The convergence of technical setups, sector rotation signals, and volume confirmation being flagged by screeners right now is creating one of the more compelling equity environments in recent memory. Traders who understand how to read and act on a stock screener breakout with discipline and patience are positioned to capture what the data is already beginning to telegraph.