US stocks closed lower Wednesday as President Trump prepared to unveil new tariffs on US auto imports.
The benchmark S&P 500 (^GSPC) was down more than 1.1%, while the Dow Jones Industrial Average (^DJI) fell about 0.4%. The tech-heavy Nasdaq Composite (^IXIC) led the losses, sliding over 2%. Tech leaders Nvidia (NVDA) and Tesla (TSLA) both closed down more than 5%.
Stocks are on shifting sands as markets respond to changes in tone from Trump on coming tariffs. The White House press secretary said Wednesday that Trump would hold a press conference at 4 p.m. ET to announce new tariffs on auto imports, hitting Tesla and other auto stocks like GM (GM) and Ford (F).
Meanwhile, Wall Street is focused on how “flexible” Trump will be in the reciprocal duties set to take effect on April 2.
In another tone shift, Trump told Newsmax on Tuesday that he “doesn’t want to have too many exceptions” to the levies — a potential swing back to the hard line seen earlier in March. Those threats directed at the EU and Canada fueled a sell-off that pushed the S&P 500 into correction territory.
Also, the White House appears to be accelerating its plans for copper levies. Tariffs on copper imports could be coming within several weeks, months ahead of a deadline for implementing the measures, Bloomberg reported. Copper (HG=F) prices surged to a record on the heels of the news.
In corporates, GameStop (GME) stock jumped over 11% after the video game retailer’s approval of a plan to buy bitcoin (BTC-USD) with its cash holdings.
In other economic news, orders for durable goods came in stronger than expected in February, data released Wednesday showed. The 0.9% rise topped expectations for a drop of 1% but undershot January’s 3.3% reading.
As bitcoin’s (BTC) recovery rally continues, $90,000 is now the key level where things could get interesting. The projection is based mainly on the current positioning of options market makers.
Market makers, also known as dealers or MMs, are responsible for providing liquidity to the order book. They occupy the opposite side of investors’ trades and work to maintain a market-neutral exposure by hedging in spot and futures markets. They make money off the difference between what they pay for an asset and how much they sell it for, known as the bid-ask spread.
Deribit bitcoin options data tracked by Amberdata shows market makers are “short gamma” at the $90,000 strike. What that means is that as the bitcoin price moves closer to that level, market makers will need sell when the spot price drops and buy when it rises to keep a market-neutral position. These hedging activities could add to market volatility.
“Considering that negative gamma will still significantly impact the market after settlement, the hedging behavior of MMs may further promote price fluctuations,” Griffin Ardern, the chief author of BloFin Academy and head of BloFin Research and Options, told CoinDesk. “But the possibility of upward price movement seems to be greater for now.”
Gamma represents the rate of change in delta, which itself measures the sensitivity of an option’s price to changes in the underlying asset’s price. Holding short gamma means holding a short position in options, which can lead to financial loss, especially during periods of high volatility. So when market makers are short gamma, they must trade in the market’s direction to maintain a market-neutral book.
The opposite is the case when market makers are long gamma. Toward the end of last year, market makers were long gamma at $90,000 and $100,000, which led to consolidation between these levels.
The chart shows gamma levels at strike prices across expirations. It’s clear that the $90,000 strike will remain the one with the most negative delta following the quarterly settlement due this Friday.
In other words, the hedging behavior of dealers could add to market swings at around $90,000.
According to Ardern, the dealer gamma profile of BTC following Friday’s expiration will look similar to the gold-backed PAXG token.
“After removing the impact of options about to be settled, PAXG has a similar GEX distribution to BTC. The price gets support after a significant price decline and encounters resistance when it rises significantly, that is, a wide range of fluctuations,” Ardern said.
Wall Street stocks ended higher on Tuesday, with Apple rising and Nvidia dipping as investors assessed consumer sentiment data and bet on a more flexible trade policy stance from the Trump administration next week.
U.S. President Donald Trump said on Monday that automobile tariffs were coming soon, while suggesting that not all proposed tariffs would be enforced in an April 2 announcement on which Wall Street is focused.
“I don’t expect that we’ll get the clarity that the market is hoping for, but investors are desperate for any sort of clarity on this front, and to the extent they’ll get some of it, it’s a huge day,” said Ross Mayfield, an investment strategist at Baird.
Weighed by worries that Trump’s tariffs would fuel inflation and hurt economic growth, the S&P 500 is down about 2% so far in 2025, and it is on track for its first quarterly loss since June 2023.
Ratings agency Moody’s said on Tuesday that the United States’ fiscal strength is on track for a continued multiyear decline as budget deficits widen and debt becomes less affordable.
Another report revealed, opens new tab a dip in consumer confidence, with the index falling to 92.9 in March – its lowest since February 2021.
Apple (AAPL.O), opens new tab rose 1.4%, helping keep the Nasdaq in positive territory, while Nvidia (NVDA.O), opens new tab slid 0.6%.
Tesla shares rose 3.45%, adding to a 12% rally the previous day. The company’s market share in Europe continued to shrink in February as sales of the all-electric car maker dropped for a second month, even as EV registrations overall on the continent grew.
KB Home (KBH.N), opens new tab fell over 6% after the homebuilder cut its full-year 2025 revenue forecast.
The S&P 500 climbed 0.16% to end the session at 5,776.65 points.
The Nasdaq gained 0.46% to 18,271.86 points, while the Dow Jones Industrial Average rose 0.01% to 42,587.50 points.
Of the 11 S&P 500 sector indexes, seven rose, led by communication services (.SPLRCL), opens new tab, up 1.43%, followed by a 0.98% gain in consumer discretionary (.SPLRCD), opens new tab.
Fed Governor Adriana Kugler said the central bank’s interest rate policy remains restrictive, but progress on bringing inflation back to the central bank’s 2% target has slowed.
New York Fed President John Williams said firms and households were “experiencing heightened uncertainty” about what lies ahead for the economy.
Among a cascade of economic indicators scheduled this week, focus will be on the personal consumption expenditures price index – the Fed’s preferred inflation gauge – due on Friday.
CrowdStrike (CRWD.O), opens new tab gained 3.3% after brokerage BTIG raised its rating on the cybersecurity company to “buy” from “neutral.”
Declining stocks outnumbered rising ones within the S&P 500 (.AD.SPX), opens new tab by a 1.3-to-one ratio.
The S&P 500 posted 11 new highs and 4 new lows; the Nasdaq recorded 42 new highs and 160 new lows.
Volume on U.S. exchanges was relatively light, with 13.0 billion shares traded, compared with an average of 16.4 billion shares over the previous 20 sessions.
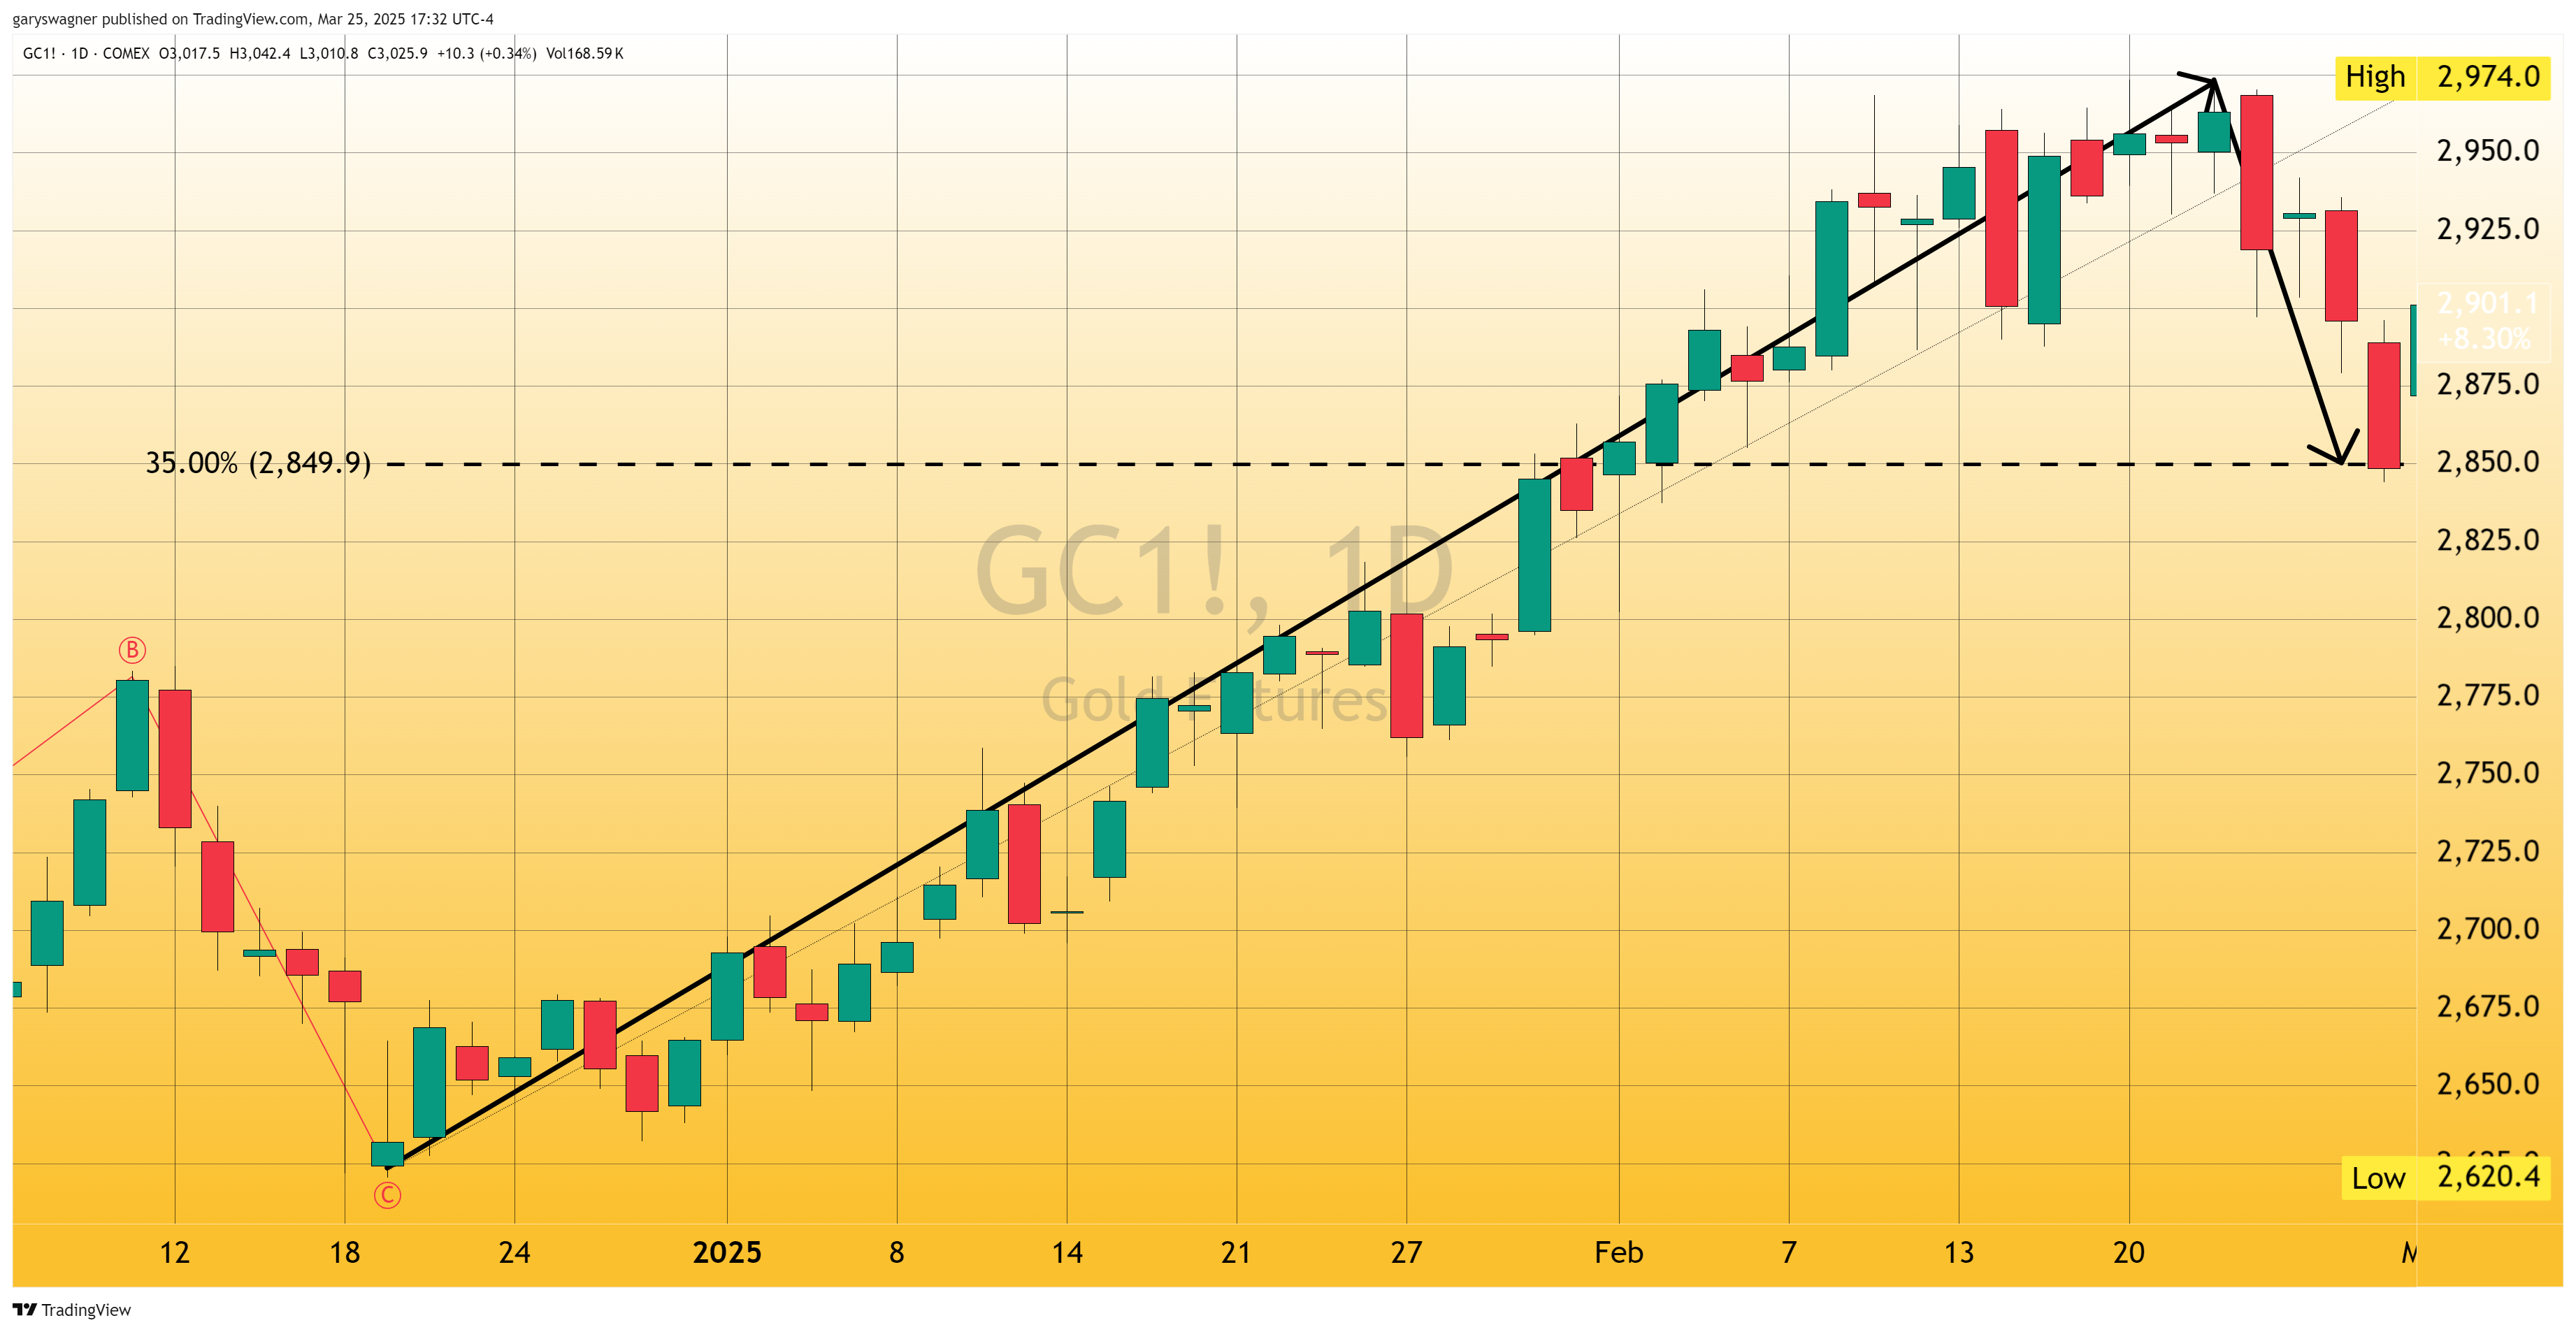
Gold has demonstrated extraordinary resilience in recent months, staging an impressive rally that has captured the attention of investors worldwide. From mid-December to February, the precious metal experienced a remarkable price advance of $343, showcasing its underlying strength and potential for further growth.
The market’s recent price action reveals a nuanced and compelling narrative of strategic movements and sustained bullish momentum. The initial rally began at $2,620 in mid-December, surging impressively to $2,963.20 by late February. What sets this market performance apart are the remarkably controlled corrections that followed, characterized by their shallow depth and brief duration.
The first correction saw a 35% pullback of $122, while a subsequent Fibonacci correction dropped from $3,065 to $3,007, representing just a 23.6% retracement. These measured movements suggest an underlying market strength that continues to support gold’s upward trajectory, even as technical indicators suggest an overbought condition.
David Morrison from Trade Nation provides an intriguing perspective on gold’s potential, suggesting an alternative scenario where gold could continue its upward momentum. He offers a balanced view, acknowledging both the possibility of a continued rally and the potential for a further pullback or consolidation.
The upcoming Personal Consumption Expenditure (PCE) index data emerges as a critical focal point. This economic indicator could provide crucial insights into monetary policy, potentially serving as a significant catalyst for gold prices and investor sentiment.
A confluence of global economic factors is driving gold’s current market position. The dollar index has experienced fractional declines, traditionally a positive indicator for gold prices. Escalating international trade tensions and geopolitical uncertainties are simultaneously increasing gold’s appeal as a safe-haven asset.
Ongoing trade conflicts, including potential tariff implementations and tensions in global markets, are further enhancing gold’s attractiveness as a store of value. The constant threat of economic instability continues to drive investors towards this precious metal.
The latest market data paints an encouraging picture. The April gold futures contract stands at $3,025.90, with a recent net gain of $10.30, representing a 0.34% increase. Overseas trading in Australia has seen the contract reach $3,026.10, indicating sustained global interest.
Investors are advised to maintain a close watch on several key indicators. The upcoming PCE index data, potential shifts in Federal Reserve monetary policy, ongoing geopolitical developments, and movements in the dollar index will all play crucial roles in shaping gold’s future trajectory.
For those who want more information on our premium service, click here
Wishing you, as always good trading,
Tesla stock (TSLA) led gains among the “Magnificent Seven” on Monday, surging nearly 12% amid investor optimism that President Trump’s tariff plans may not be as wide-reaching as previously anticipated.
Reports that Trump will hold off on bringing in levies on the auto sector on April 2 eased worries that Tesla’s bottom line would be impacted.
Shares of the EV maker had already been on a downward trend amid concerns of a drop in sales and a backlash against the brand over CEO Elon Musk’s involvement in politics.
The stock began digging out of its most recent dip last week when Tesla revealed plans to launch its robotaxi service in 2025.
On Monday, the electric car maker responded to complaints about a pause in its Full Self-Driving trial in China, saying it will release the features once regulatory approval is secured.
Last Thursday, CEO Elon Musk held an impromptu company all-hands, giving an update on the progress of a number of products while also attempting to assuage fears that he wasn’t ignoring his post.
The electric vehicle manufacturer’s sales have slipped recently in key regions like Europe, China, and even the US.
As Yahoo Finance’s Pras Subramanian recently reported, not only has the changeover to the new Model Y SUV been seen as a drag on sales, but Musk’s closeness to President Trump and embrace of right-wing politics may be also impacting the brand.
Tesla shares are down roughly 31% year-to-date.
BEIJING, March 24 (Reuters) – Chinese electric vehicle maker BYD’s (002594.SZ), opens new tab net profit leapt 73.1% in the fourth quarter of 2024 to a record 15 billion yuan ($2.1 billion), it said on Monday, reaping the rewards of lower prices and higher sales than rivals.
Fourth-quarter revenue was up 52.7% at 274.9 billion yuan, the company said in a stock market filing.
For the whole of last year, profit rose 34% to a record 40.3 billion yuan on revenue up 29%.
BYD’s shares in Hong Kong have risen by 51% year-to-date and are currently slightly off an all-time-high reached last week.
The Chinese EV champion overtook Volkswagen to lead China’s car sales with a record 4.25 million vehicles in 2024.
The company has continued to roll out cheaper models, contributing to the deepening of a brutal two-year price war in the world’s largest auto market.
It has also roiled the market in recent weeks by unveiling a new super-charging EV technology platform and announcing that it will offer smart driving features on most of its line-up at no extra charge.
Sales of autos and related products that accounted for 79.4% of the company’s operating revenue generated a 22.3% gross profit margin last year, up 1.3 percentage points from a year earlier.
The Warren Buffett-backed automaker said earlier this month it had raised $5.59 billion in a primary share sale that was increased in size, with proceeds to be invested in research and development, and expanding overseas, among other purposes.
BYD is considering Germany for a possible third plant in Europe, Reuters has reported. Its overseas shipments jumped 71.9% last year to make up 10% of overall car sales.
Here’s what happens next, and what to do about it.
I come today bearing good news and bad news, and I’ll give you the good news first: The S&P 500 (^GSPC 0.08%) is no longer in a “correction.”
Since closing at its highest ever level of 6,144 on Feb. 19, this index tracking the performance of America’s 500 biggest companies tumbled quickly to close at 5,522 on March 13, 10.1% below its all-time high. It’s recovered since and, as of Friday’s market close, the S&P 500 is currently down only… 7.8% at a little under 5,668. So we’re out of correction territory, and perhaps ready to resume moving higher again.
Or perhaps not.
The U.S. Stock Market: A short history of its crashes
Established back in March 1957, the S&P 500, per se, hasn’t been around to track the entire history of the U.S. stock market. But the Standard Statistics Company, predecessor to S&P Global (SPGI 0.10%), has, starting in 1923, when it began tracking the weekly stock performance of 233 U.S. companies.
Over that roughly 100-year time period, these S&P indexes have recorded no fewer than 15 separate bear markets in which S&P companies lost 20% or more of their value. Some of these crashes were gigantic, such as the 86% decline that began in 1929, or the only slightly less terrible 60% decline that began in 1937.
Other crashes were somewhat less serious. In 1956, an event that may have sparked the creation of the S&P 500 itself saw the stock market decline only 21.5%. Or consider the 1990 bear market, which might not even have been a technical bear market, depending on how far out you count your decimals, because the decline was only 19.9% top to bottom.
Still, over time and on average, bear markets are plenty serious. Across 15 S&P bear markets in 100 years, we find investors suffer more than a 38% decline in the average stock market crash.
Why the February S&P 500 correction might be the start of something worse
That number — 38% — stuck out to me recently when considering a report from the St. Louis Fed, which crunched U.S. Bureau of Economic Analysis data to prepare a surprisingly clear graph of what “normal” corporate profit margins look like in the U.S.
Basically, they look like this:
Image source: FRED (with red lines added), via John Mauldin’s Thoughts from the Frontline newsletter.
Which is to say that, for the past 75 years or so, from 1936 through 2011 — or practically the entire history of the U.S. stock market, except only the time of the Great Depression — U.S. companies have averaged somewhere between 3.8% and 7.2% profit margins on their revenues.
Something changed in 2012, however, and then changed more dramatically when COVID-19 arrived in 2020, and pushed U.S. corporate profit margins far beyond their “normal” range. History suggests this kind of a leap higher may not be sustainable. And here’s what worries me:
Averaging profit margins of 9% today, a “reversion to the mean” to just 7.2% profit margin — the upper bound of the historical range — would imply a 20% drop in absolute corporate profits from current levels.
What happens when profit margins shrink?
Now here’s why I worry such a reversion to the mean could spark a bigger stock market collapse: When earnings decline because of smaller profit margins, the “multiples” that investors are willing to pay to own those earnings tend to decline as well. And this can hit stock markets with a double whammy, as not only do earnings fall, but the stock price that investors are willing to pay times those earnings also falls.
How does this work? Consider a hypothetical company “Capitalism ‘R’ Us” that earns $1 per share. Right now, investors are paying about 28 times earnings for the average S&P stock.
28 x $1 = a $28 stock price on Capitalism.
But now assume that, because of a shrinking profit margin, Capitalism is only able to earn $0.80 per share. Alarmed by this development, investors cut the multiple they’re willing to pay for Capitalism’s stock by, say, 25%, to 21x earnings.
21 x $0.80 = Capitalism is now worth only $16.8.
Abracadabra, Capitalism’s stock price just dropped 40%, which happens to be very close to what the data show us is the average stock market value drop in a bear market over the last 100 years.
A little good news for optimists
Now, it’s not all bad news. Despite crashing 15 times in 100 years, the S&P 500 has still averaged 10% to 11% annual growth including dividends over this same period. History gives us no reason to think that will change, so there’s still hope here for long term investors. We just may need to cross one more yawning chasm first, before growth resumes.
So, how should you prepare for it?
Refocus your portfolio on individual value stocks that you know aren’t overpriced regardless of whether “the stock market” as a whole is overpriced. Avoid leverage. Avoid debt. Avoid risky stocks, meme stocks, and crypto coins that don’t offer clear value. And when the crash comes, understand that you may not know when it will end, but you do know that it will end.
Hold on tight. Stay invested, and keep investing — in the right kinds of stocks.
(RTTNews) – The Japanese stock market is trading slightly higher on Monday, recouping some of the losses in the previous three sessions, following the broadly positive cues from Wall Street on Friday. The Nikkei 225 is moving above the 37,700 level, with gains is index heavyweights partially offset by weakness in financial stocks.
The benchmark Nikkei 225 Index is up 46.76 points or 0.12 percent at 37,723.82, after touching a high of 37,841.68 earlier. Japanese shares ended modestly lower on Friday.
Market heavyweight SoftBank Group is gaining more than 3 percent and Uniqlo operator Fast Retailing is edging up 0.5 percent. Among automakers, Honda is edging up 0.3 percent and Toyota is also edging up 0.5 percent.
In the tech space, Advantest is gaining almost 1 percent, while Screen Holdings is declining more than 2 percent and Tokyo Electron is edging down 0.5 percent.
In the banking sector, Mitsubishi UFJ Financial is losing almost 1 percent, while Sumitomo Mitsui Financial and Mizuho Financial are declining more than 1 percent each.
The major exporters are mostly lower. Panasonic is losing more than 1 percent, while Sony and Canon are edging down 0.3 percent each. Mitsubishi Electric is edging up 0.5 percent.
Among the other major gainers, DeNA is gaining more than 5 percent and CyberAgent is adding almost 3 percent.
Conversely, there are no other major losers.
In the currency market, the U.S. dollar is trading in the higher 149 yen-range on Monday.
On Wall Street, stocks showed a significant recovery over the course of the trading day on Friday after moving sharply lower early in the session. The major averages climbed well off their worst levels of the day and into positive territory.
The tech-heavy Nasdaq saw a notable advance going into the close, ending the day up 92.43 points or 0.5 percent at 17,784.05 after tumbling by as much as 1.2 percent in early trading. The Dow and the S&P 500 posted more modest gains. The Dow inched up 32.03 points or 0.1 percent to 41,985.35 and the S&P 500 crept up 4.67 points or 0.1 percent to 5,667.56.
Meanwhile, the major European markets all moved to the downside on the day. While the German DAX Index fell by 0.5 percent, the French CAC 40 Index and the U.K.’s FTSE 100 Index both slid by 0.6 percent.
Crude oil prices bounced higher on Friday on geopolitical tensions after new U.S. sanctions against a Chinese refinery that purchased Iranian oil. West Texas Intermediate crude for May delivery climbed $0.23 or 0.3 percent to $68.30 a barrel.
The S&P 500 inched higher on Friday, ending four consecutive weeks of declines that were brought on by trade policy turmoil, recession fears and a rollover in megacap tech shares.
The S&P 500 added 0.08%, rising into positive territory as the trading session drew to a close. The broad market index ended the day at 5,667.56. The Nasdaq Composite gained 0.52% and settled at 17,784.05, while the Dow Jones Industrial Average
advanced 32.03 points, or 0.08%, to close at 41,985.35.
The broad-market S&P 500 posted a 0.5% weekly advance, averting a fifth straight week of losses. The Nasdaq rose 0.2% week to date, and the Dow posted a 1.2% gain.
Friday was a “quadruple witching” day, which is when stock options, index futures, index options and single-stock futures expire. Goldman estimated that more than $4.7 trillion of notional options exposure would expire.
The session was volatile with major averages coming off their lows after President Donald Trump said there would be some “flexibility” with tariffs. However, he maintained that the tariffs implemented at the April 2 deadline will be reciprocal, saying all countries that have tariffs on U.S. goods will be charged.
Trump’s tariff deadline is looming over the market, according to Michael Green, chief strategist at Simplify Asset Management.
“Companies are increasingly citing confusion and uncertainty around their planning and capital spending and hiring decisions — and when they pause, it means that they’re slowing down,” he said. “There’s an element of that playing out in the markets.”
Two economic bellwethers slid on Friday. FedEx was down 6.5% after it cut its earnings outlook, citing “weakness and uncertainty in the U.S. industrial economy.” Nike shares were off by more than 5% after the shoe and apparel giant said sales this quarter would miss analysts’ expectations because of tariffs and falling consumer confidence.
The S&P 500 briefly fell into correction territory at one point during its sell-off since late February, and it now sits nearly 8% from its record high, short of the 10% correction level. The benchmark has made some attempts to rally this month without much follow-through, including on Wednesday when it snapped back by 1% after the Federal Reserve said it would still likely cut rates two times this year.
At its GTC conference, Nvidia (NVDA -0.75%) gave investors 1 trillion potential reasons to buy its stock. That came in the form of CEO Jensen Huang projecting that data center infrastructure capital expenditure (capex) would hit $1 trillion or more by 2028.
Investors, nonetheless, largely shrugged off the robust forecast and other upbeat news from the event. That said, if Nvidia’s projections come to fruition, the stock has a lot more upside from here.
More growth to come
$1 trillion in data center infrastructure capex by 2028 would be a continued acceleration of spending in the space, which would be great news for Nvidia. The company’s graphics processing units (GPUs) have become the backbone of the artificial intelligence (AI) infrastructure buildout, due to their powerful data processing abilities and ease of use.
In a chart from the presentation, Nvidia estimated 2024 data center infrastructure spending to be around $400 billion in 2024. For its past fiscal year (fiscal year 2025 ended in January), the company produced total revenue of $130.5 billion, of which $115.2 billion was from its data center segment. Meanwhile, research company Dell’Oro Group just estimated that 2024 data center infrastructure spending reached $455 billion. That translates into Nvidia currently capturing around 25% to 30% of this spending.
If Nvidia was able to keep its current share of this spending, that would translate into between $250 billion to $300 billion in data center infrastructure revenue alone in 2028. The company plans to continue to lead the way with both its chips and its software. It introduced the new Blackwell Ultra GPU at the event, which will begin shipping in the second half of this year. The new Blackwell chips are more powerful, making them great for more time-sensitive services. Nvidia predicted Blackwell revenue would be much greater than the revenue it generated from its earlier Hopper architecture.
Continuing with its chip innovation, the company is also set to introduce its new Vera Rubin chip, which will combine a GPU with its next-generation Rubin architecture and a custom-designed central processing unit (CPU), using Arm‘s technology. It said the CPU will be twice as fast as the off-the-shelf one used in its earlier Grace Blackwell chips. Meanwhile, it will look to increase the number of GPU dies in its current Blackwell chips from two to four with the “Rubin Next” chip that it plans to launch in the second half of 2027.
Nvidia isn’t just innovating on the hardware side. It also revealed a new open-source software system called Nvidia Dynamo that will help increase inference throughput and reduce costs. The company said the new software will help orchestrate and accelerate inference communication across thousands of GPUs. It said that Dynamo is not just an operating system for a data center, but for an entire AI factory.
Nvidia doesn’t just have its sights set on data centers, though. It’s looking to tackle the robotics and autonomous driving markets as well. Huang proclaimed that “the age of generalist robotics is here” with the introduction of Isaac GROOT N1, which he called the world’s first “open Humanoid Robot foundation model.” The model can be trained on real or synthetic data to help humanoid robots master tasks. The company thinks these robots will be able to fill menial labor jobs and help with a global 50-million-job shortage.
The company will also team up with General Motors to help the automaker develop its own autonomous driving system. The move is somewhat surprising, since GM scrapped its prior attempt at a robotaxi business last year. The unit became mired in controversy when one of its Cruise robotaxis dragged a pedestrian down the road after the person was originally hit by another vehicle.
Nvidia said that in addition to supplying GPUs, it will help GM build custom AI systems. GM will also use Nvidia’s GPUs and software to train AI manufacturing models in order to build next-generation factory robots. This follows Nvidia striking a deal with Toyota last month to provide chips and software to help run its advanced driver-assistance features.
Is the stock a buy?
While Nvidia has been the biggest winner of the AI infrastructure buildout, it still has a very large opportunity in front of it. AI infrastructure spending is still increasing, and Nvidia is not resting on its laurels. It continues to drive innovation and is looking to make sure it’s the winner in AI inference, not just AI training. Meanwhile, it’s looking for growth beyond the data center into other large potential markets.
At the same time, Nvidia’s stock remains attractively valued following the recent market sell-off. The stock trades at a forward price-to-earnings (P/E) ratio of under 26 times this year’s analyst estimates and a price/earnings-to-growth (PEG) below 0.5. A PEG of 1 is typically the threshold for a stock being considered undervalued, and Nvidia’s multiple is way below this mark.
As such, Nvidia looks like a solid long-term buy at these levels.


 US Government confirms Social Security payment on May 7 only for these retirees and disability beneficiaries
 Americans are more worried about running out of money in retirement than dying. Experts offer ways to reduce that risk
 Spirit Airlines gets approval for NYSE American listing
 Archer Aviation (NYSE:ACHR) Partners With United Airlines For New York City Air Taxi Network
 Trump embraces ‘tailored’ tariff deals as foreign leaders look to sweeten their offers
 Why some are accusing Trump of manipulating stock markets
 Bezos-backed Slate Auto unveils affordable EV truck
 Big brands are officially worried about American shoppers
 Intel CFO says tariffs increase chance for economic slowdown, recession getting likelier
 Fed’s Kashkari nervous that trade policy uncertainty will lead to layoffs