A Look at Endava (NYSE:DAVA) Valuation Following New TRD U.S.A. Partnership and Quarterly Earnings Update

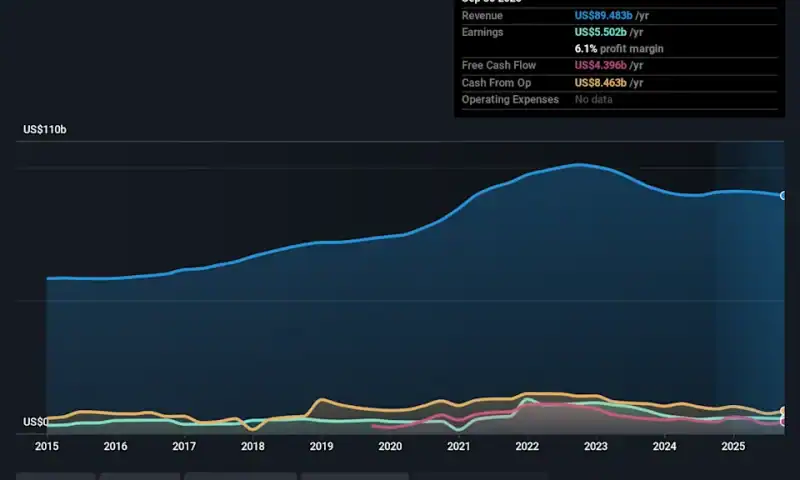
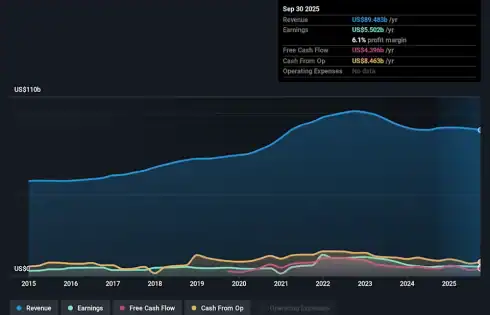
Endava (NYSE:DAVA) just announced it will deepen its relationship with TRD U.S.A., continuing as the motorsports company’s Official IT Consulting Partner and expanding into new circuits. This development comes at the same time as Endava’s recent quarterly results and fresh guidance, giving investors plenty to digest.
Endava’s new TRD U.S.A. partnership and recent earnings update landed just as the company’s shares slipped to $6.95, reflecting a year-to-date share price decline of 77.21%. While the expanded motorsports exposure hints at future growth, momentum remains challenged as the one-year total shareholder return stands at -76.44% and the three-year total at -91.36%. Investors appear cautious, weighing promising partnerships against recent operational headwinds.
If you’re curious where the next big winner might emerge, this could be an ideal time to broaden your radar and discover fast growing stocks with high insider ownership
Despite steep losses over the past year, Endava now trades significantly below analyst targets. Is this a long-term buying opportunity, or is the market simply reflecting persistent operational risks and muted future growth?
Most Popular Narrative: 59.3% Undervalued
Endava’s most popular narrative values the company at $17.08 per share, far above the last close of $6.95. This mismatch highlights a dramatic disconnect and a potential opportunity that investors are watching closely.
Endava’s focus on AI-enabled capabilities, such as Morpheus and Compass, positions it to leverage the digital shift. This could expand its addressable market and drive future revenue growth through AI-driven services. The company’s strategy of securing larger and longer-term deals, particularly in core modernization projects, is expected to contribute to meaningful revenue growth and stability in earnings, despite longer sales cycles.
Read the complete narrative.
Want to know what’s fueling this outsized valuation gap? Hint: The narrative hinges on bold projections about long-term profit improvement and the power of cutting-edge tech partnerships. Which financial forecast is most crucial to this story? Find out what’s behind the numbers and see why analyst consensus draws a sharp line between current prices and potential upside.
Result: Fair Value of $17.08 (UNDERVALUED)
However, slow sales cycles for AI projects and ongoing economic uncertainty in key markets could limit Endava’s expected revenue growth and margin improvement.
Build Your Own Endava Narrative
If you see things differently or want to dig deeper into the numbers yourself, crafting your own perspective takes just a couple of minutes. Do it your way
A great starting point for your Endava research is our analysis highlighting 3 key rewards and 1 important warning sign that could impact your investment decision.
Ready for More Stock Opportunities?
Smart investors always keep their radar wide. Don’t let your next great idea slip away. Simply Wall Street’s powerful screener unlocks unique investment themes and trends beyond the obvious.
-
Uncover the market’s most resilient payout opportunities and access these 15 dividend stocks with yields > 3% delivering yields above 3%.
-
Jump ahead of the curve by targeting breakthrough trends with these 25 AI penny stocks, focused on the next generation of artificial intelligence leaders.
-
Capture hidden value by seeking out these 858 undervalued stocks based on cash flows poised for growth based on real cash flow strength.