Otis (NYSE:OTIS) Misses Q4 CY2025 Sales Expectations

Elevator manufacturer Otis (NYSE:OTIS) missed Wall Street’s revenue expectations in Q4 CY2025 as sales rose 3.3% year on year to $3.80 billion. The company’s full-year revenue guidance of $15.15 billion at the midpoint came in 0.7% below analysts’ estimates. Its non-GAAP profit of $1.03 per share was in line with analysts’ consensus estimates.
Otis (OTIS) Q4 CY2025 Highlights:
- Revenue: $3.80 billion vs analyst estimates of $3.87 billion (3.3% year-on-year growth, 1.8% miss)
- Adjusted EPS: $1.03 vs analyst estimates of $1.03 (in line)
- Adjusted EBITDA: $651 million vs analyst estimates of $675.7 million (17.1% margin, 3.7% miss)
- Operating Margin: 15.5%, up from 14.4% in the same quarter last year
- Free Cash Flow Margin: 20.3%, up from 17.7% in the same quarter last year
- Organic Revenue rose 1% year on year (miss)
- Market Capitalization: $35.29 billion
Company Overview
Credited with inventing the first hydraulic passenger elevator, Otis Worldwide (NYSE:OTIS) is an elevator and escalator manufacturing, installation and service company.
Revenue Growth
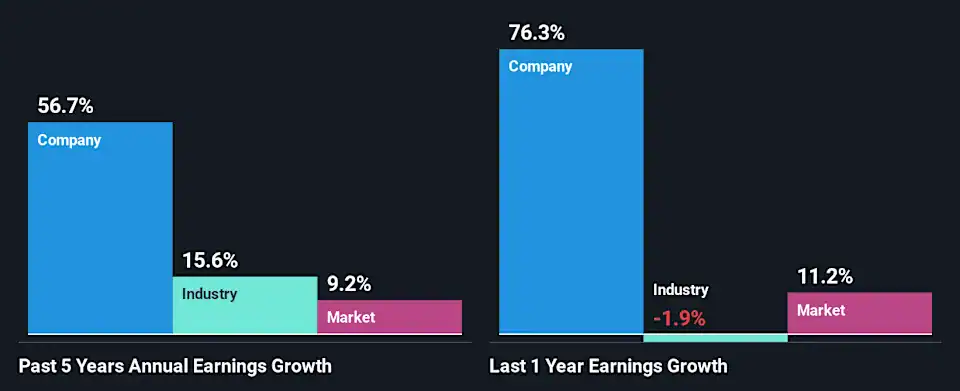
Reviewing a company’s long-term sales performance reveals insights into its quality. Any business can have short-term success, but a top-tier one grows for years. Over the last five years, Otis grew its sales at a sluggish 2.5% compounded annual growth rate. This was below our standards and is a rough starting point for our analysis.

We at StockStory place the most emphasis on long-term growth, but within industrials, a half-decade historical view may miss cycles, industry trends, or a company capitalizing on catalysts such as a new contract win or a successful product line. Otis’s recent performance shows its demand has slowed as its revenue was flat over the last two years.

Otis also reports organic revenue, which strips out one-time events like acquisitions and currency fluctuations that don’t accurately reflect its fundamentals. Over the last two years, Otis’s organic revenue was flat. Because this number aligns with its two-year revenue growth, we can see the company’s core operations (not acquisitions and divestitures) drove most of its results.

This quarter, Otis’s revenue grew by 3.3% year on year to $3.80 billion, falling short of Wall Street’s estimates.
Looking ahead, sell-side analysts expect revenue to grow 5.5% over the next 12 months. Although this projection indicates its newer products and services will catalyze better top-line performance, it is still below average for the sector.
Software is eating the world and there is virtually no industry left that has been untouched by it. That drives increasing demand for tools helping software developers do their jobs, whether it be monitoring critical cloud infrastructure, integrating audio and video functionality, or ensuring smooth content streaming. Click here to access a free report on our 3 favorite stocks to play this generational megatrend.
Operating Margin
Otis’s operating margin might fluctuated slightly over the last 12 months but has generally stayed the same, averaging 14.8% over the last five years. This profitability was top-notch for an industrials business, showing it’s an well-run company with an efficient cost structure. This result was particularly impressive because of its low gross margin, which is mostly a factor of what it sells and takes huge shifts to move meaningfully. Companies have more control over their operating margins, and it’s a show of well-managed operations if they’re high when gross margins are low.
Analyzing the trend in its profitability, Otis’s operating margin might fluctuated slightly but has generally stayed the same over the last five years. This raises questions about the company’s expense base because its revenue growth should have given it leverage on its fixed costs, resulting in better economies of scale and profitability.

In Q4, Otis generated an operating margin profit margin of 15.5%, up 1.1 percentage points year on year. The increase was encouraging, and because its operating margin rose more than its gross margin, we can infer it was more efficient with expenses such as marketing, R&D, and administrative overhead.
Earnings Per Share
We track the long-term change in earnings per share (EPS) for the same reason as long-term revenue growth. Compared to revenue, however, EPS highlights whether a company’s growth is profitable.
Otis’s EPS grew at a remarkable 12.1% compounded annual growth rate over the last five years, higher than its 2.5% annualized revenue growth. This tells us the company became more profitable on a per-share basis as it expanded.

We can take a deeper look into Otis’s earnings to better understand the drivers of its performance. A five-year view shows that Otis has repurchased its stock, shrinking its share count by 10.1%. This tells us its EPS outperformed its revenue not because of increased operational efficiency but financial engineering, as buybacks boost per share earnings.

Like with revenue, we analyze EPS over a more recent period because it can provide insight into an emerging theme or development for the business.
For Otis, its two-year annual EPS growth of 7% was lower than its five-year trend. We hope its growth can accelerate in the future.
In Q4, Otis reported adjusted EPS of $1.03, up from $0.93 in the same quarter last year. This print was close to analysts’ estimates. Over the next 12 months, Wall Street expects Otis’s full-year EPS of $4.05 to grow 9%.
Key Takeaways from Otis’s Q4 Results
We struggled to find many positives in these results. Its revenue missed and its EBITDA fell short of Wall Street’s estimates. Overall, this quarter could have been better. The stock traded down 2.7% to $88.11 immediately following the results.
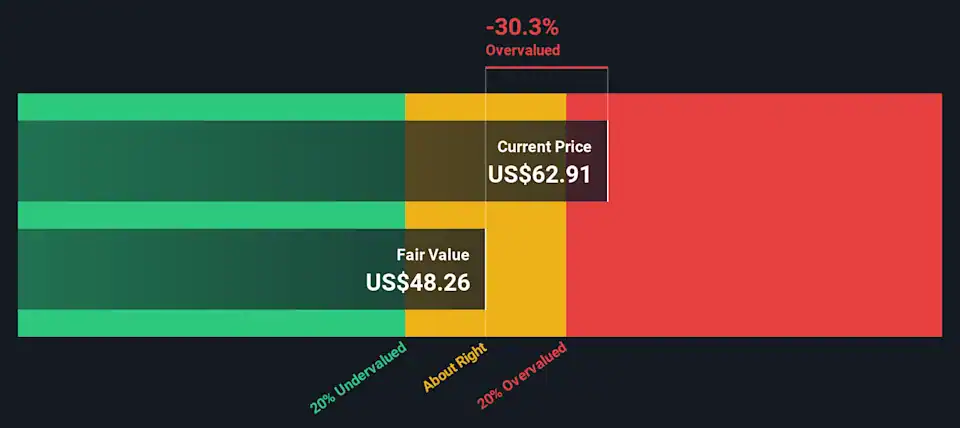
Otis’s latest earnings report disappointed. One quarter doesn’t define a company’s quality, so let’s explore whether the stock is a buy at the current price. We think that the latest quarter is just one piece of the longer-term business quality puzzle. Quality, when combined with valuation, can help determine if the stock is a buy.