Wall Street has resumed its rise this week, on the back of a possible end to the government shutdown, at least in the short term. The first week of the month saw a selloff of almost $1 trillion in tech stocks, which comprise around 40 percent of the market value of the S&P 500 index. The downturn, in which the tech-heavy NASDAQ index fell by 3 percent, was the most significant since the market turmoil set off by President Trump’s “reciprocal tariffs” announced at the beginning of April.
As Wall Street resumes its upward momentum, at least for now, three major issues are emerging that could bring significant turmoil to the US and global financial markets. These are: when the artificial intelligence (AI) bubble will burst and what will be the consequences; the increasing role of private credit in financing riskier debt, outside the regulations that apply to banks; and the possibility of a liquidity crunch in the short-term repurchase or repo market, which plays a key role in financing trades in the US Treasury market.
Amid the warnings that massive AI investments—OpenAI has entered deals worth $1.4 trillion in computing power over the next eight years with a revenue of just $20 billion this year—will lead to a collapse, there have been reassurances that the companies funding the deals have been doing so with their own cash and they retain a strong cash flow. But that situation is changing rapidly as the demand for investment funds escalates and there is an increasing turn to debt financing.
The Financial Times (FT) reported at the beginning of the month that US companies had issued $200 billion worth of bonds since the start of the year to finance AI-related projects. Analysts predict that “the splurge will ‘flood’ the broader market and store up new debt risks for credit investors.” The chief strategist at Bank of America, Michael Hartnett, has noted that $120 billion has been raised by what are termed the AI hyperscalers: Amazon, Google, Meta, Microsoft, and Oracle. In just seven weeks, more debt will be needed.
In a note to clients last Friday, he said the “cash flow [of these companies] is insufficient to fight the AI capex arms race,” pointing out that by next year, the expected capital spending of $534 billion would comprise 80 percent of this group’s expected cash flow. The risk of financial problems is inherent in the very nature of AI development within the framework of the capitalist economy and its market relations. Large investments in infrastructure, not least the provision of massive amounts of electricity, are needed up front. But the financial benefits of AI will only start to flow over the longer term.
In the interim, rapid developments in AI technology mean that the assets in which hundreds of billions of dollars have been invested could undergo a major depreciation because superior chips or systems have been developed. That process has already been seen back in January when the Chinese firm DeepSeek developed a new chip at a lower cost than US firms. Comments by analysts reported in the FT point to this development as debt comes to play an increasing role in the AI boom.
Gil Luria, head of technology research at the investment firm DA Davidson, said companies that had committed themselves to huge projects for one company were going to have to raise “expensive capital.” The bonds issued so far had not been too expensive, but “the companies are going to need hundreds of billions of dollars more. If the markets end up investing hundreds of billions of debt in rapidly depreciating assets that may not have sufficient returns, the risk could become systemic.”
What this means is that because the amounts are so large and the companies involved play such a large role in the stock market, their problems will send a shock wave through the financial system as a whole. According to Gita Gopinath, who recently stepped down from a top post at the International Monetary Fund, a collapse of the AI bubble on the scale of the ending of the dot-com boom at the beginning of the century would inflict losses of $20 trillion in the US and $15 trillion in the rest of the world. This would be equivalent to 70 percent of US GDP and 20 percent of the rest of the world’s.
Fraser Lundie, in charge of fixed income investment at Aviva Investments, said the surge in debt issuance raised “important questions about concentration risk [and] capex sustainability,” as well as market sensitivity to interest rates because of the long duration of the bonds being sold by tech groups.
The issue of the role of private credit within the financial system has been simmering for some time but has come into greater prominence with the collapse of the auto company First Brands and the bankruptcy of the sub-prime auto finance firm Tricolor, which had both been funded from this source. These events have attracted the attention of Bank of England Governor Andrew Bailey.
Testifying before the House of Lords financial services regulation committee last month, he said following their collapse, “alarm bells” were ringing over lending by private credit markets and recalled what had led up to the 2008 global financial crisis. “We are certainly beginning to see, for instance, what used to be called slicing and dicing and tranching of loan structures going on, and if you were involved before the financial crisis then alarm bells start going off at that point.” These activities served to cover the risk inherent in the underlying assets.
Bailey said it was still an “open question” as to whether these failures were “the canary in the coal mine” and whether they pointed to “something more fundamental” in private credit markets. Sarah Breeden, deputy governor for financial stability at the BoE, told the committee: “We can see the vulnerabilities here, the opacity, the leverage, the weak underwriting standards, the interconnections. We can see parallels with the global financial crisis. What we don’t know is how macro-significant those issues are.”
It was a telling comment. It made clear that the supposed financial watchdogs, guardians, and regulators of the capitalist financial system, with all the information technology at their disposal, have no real idea if a crisis is developing and will only know when it breaks over their heads.
One of the features of the 2008 crisis was the way in which the major credit rating agencies were giving top credit ratings to packages built on inherently risky assets, not only in the sub-prime mortgage market but in other parts of the financial system. In the present conditions, that role has been taken up by the rapid growth of rating agencies outside the big three—Moody’s, S&P Global, and Fitch—enabling debt sellers to shop around for a more favourable rating.
The head of the Swiss-based global bank UBS, Com Kelleher, drew attention to this practice at a finance conference in Hong Kong earlier this month. He said insurance companies, particularly in the US, were engaging in “ratings arbitrage” similar to that carried out by banks before the 2008 crisis. The issue has also been raised in a recent analysis by the Bank for International Settlements.
Another potential source of instability, even a crisis, is the repo market. It is at the center of what is known as the basis trade under which financial investors seek to make a profit from the tiny difference in the price of Treasury futures and their present price. The futures are sold, and Treasuries are bought to meet that trade. But the difference is tiny and in order to make a real profit, it must be repeated over and over with debt.
The Treasury bond that has been purchased can be used as collateral for an ultra-short-term loan from the repo market and used to buy another bond as more futures are sold. The result, as an analysis by the FT in April showed, can be that just $10 million may, through such leverage, support as much as $1 billion of Treasury purchases. The whole operation depends on the very low interest rate in the repo market where funds are borrowed. But if that rises because of a tightening of liquidity, the whole operation can unravel.
Such an occurrence took place in September 2019 and required a major intervention by the US Federal Reserve. At its meeting last month, the Fed recognized that strains were developing in the repo market and took action to increase liquidity by announcing that as of December, it would cease its quantitative tightening program, in which it wound down its holdings of US Treasuries. It may soon become a buyer again, injecting more money into the system. That action has eased the tensions that were building up. But any sudden or unexpected development within the US or in global markets could see them rapidly develop again, such is the knife edge on which the entire financial system is presently balanced.

 On Wednesday, OpenAI released GPT-5.1 Instant and GPT-5.1 Thinking, two updated versions of its flagship AI models now available in ChatGPT. The company is wrapping the models in the language of anthropomorphism, claiming that they’re warmer, more conversational, and better at following instructions.
The release follows complaints earlier this year that its previous models were excessively cheerful and sycophantic, along with an opposing controversy among users over how OpenAI modified the default GPT-5 output style after several suicide lawsuits.
The company now faces intense scrutiny from lawyers and regulators that could threaten its future operations. In that kind of environment, it’s difficult to just release a new AI model, throw out a few stats, and move on like the company could even a year ago. But here are the basics: The new GPT-5.1 Instant model will serve as ChatGPT’s faster default option for most tasks, while GPT-5.1 Thinking is a simulated reasoning model that attempts to handle more complex problem-solving tasks.
OpenAI claims that both models perform better on technical benchmarks such as math and coding evaluations (including AIME 2025 and Codeforces) than GPT-5, which was released in August.
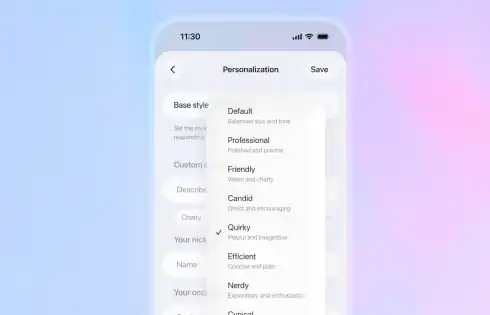
Improved benchmarks may win over some users, but the biggest change with GPT-5.1 is in its presentation. OpenAI says it heard from users that they wanted AI models to simulate different communication styles depending on the task, so the company is offering eight preset options, including Professional, Friendly, Candid, Quirky, Efficient, Cynical, and Nerdy, alongside a Default setting.
These presets alter the instructions fed into each prompt to simulate different personality styles, but the underlying model capabilities remain the same across all settings.
In addition, the company trained GPT-5.1 Instant to use “adaptive reasoning,” meaning that the model decides when to spend more computational time processing a prompt before generating output.
The company plans to roll out the models gradually over the next few days, starting with paid subscribers before expanding to free users. OpenAI plans to bring both GPT-5.1 Instant and GPT-5.1 Thinking to its API later this week. GPT-5.1 Instant will appear as gpt-5.1-chat-latest, and GPT-5.1 Thinking will be released as GPT-5.1 in the API, both with adaptive reasoning enabled. The older GPT-5 models will remain available in ChatGPT under the legacy models dropdown for paid subscribers for three months.
The company says it wants to give people time to compare model outputs and adapt at their own pace and that going forward, it will communicate deprecation periods clearly with advance notice. OpenAI also published a system card with information on its safety approach for GPT-5.1.
On Wednesday, OpenAI released GPT-5.1 Instant and GPT-5.1 Thinking, two updated versions of its flagship AI models now available in ChatGPT. The company is wrapping the models in the language of anthropomorphism, claiming that they’re warmer, more conversational, and better at following instructions.
The release follows complaints earlier this year that its previous models were excessively cheerful and sycophantic, along with an opposing controversy among users over how OpenAI modified the default GPT-5 output style after several suicide lawsuits.
The company now faces intense scrutiny from lawyers and regulators that could threaten its future operations. In that kind of environment, it’s difficult to just release a new AI model, throw out a few stats, and move on like the company could even a year ago. But here are the basics: The new GPT-5.1 Instant model will serve as ChatGPT’s faster default option for most tasks, while GPT-5.1 Thinking is a simulated reasoning model that attempts to handle more complex problem-solving tasks.
OpenAI claims that both models perform better on technical benchmarks such as math and coding evaluations (including AIME 2025 and Codeforces) than GPT-5, which was released in August.
Improved benchmarks may win over some users, but the biggest change with GPT-5.1 is in its presentation. OpenAI says it heard from users that they wanted AI models to simulate different communication styles depending on the task, so the company is offering eight preset options, including Professional, Friendly, Candid, Quirky, Efficient, Cynical, and Nerdy, alongside a Default setting.
These presets alter the instructions fed into each prompt to simulate different personality styles, but the underlying model capabilities remain the same across all settings.
In addition, the company trained GPT-5.1 Instant to use “adaptive reasoning,” meaning that the model decides when to spend more computational time processing a prompt before generating output.
The company plans to roll out the models gradually over the next few days, starting with paid subscribers before expanding to free users. OpenAI plans to bring both GPT-5.1 Instant and GPT-5.1 Thinking to its API later this week. GPT-5.1 Instant will appear as gpt-5.1-chat-latest, and GPT-5.1 Thinking will be released as GPT-5.1 in the API, both with adaptive reasoning enabled. The older GPT-5 models will remain available in ChatGPT under the legacy models dropdown for paid subscribers for three months.
The company says it wants to give people time to compare model outputs and adapt at their own pace and that going forward, it will communicate deprecation periods clearly with advance notice. OpenAI also published a system card with information on its safety approach for GPT-5.1.
 Microsoft on Tuesday released patches for 63 new security vulnerabilities identified in its software, including one that has come under active exploitation in the wild.
Of the 63 flaws, four are rated Critical and 59 are rated Important in severity. Twenty-nine of these vulnerabilities are related to privilege escalation, followed by 16 remote code execution, 11 information disclosure, three denial-of-service (DoS), two security feature bypass, and two spoofing bugs.
The patches are in addition to the 27 vulnerabilities the Windows maker addressed in its Chromium-based Edge browser since the release of October 2025’s Patch Tuesday update.
The zero-day vulnerability that has been listed as exploited in Tuesday’s update is CVE-2025-62215 (CVSS score: 7.0), a privilege escalation flaw in Windows Kernel. The Microsoft Threat Intelligence Center (MSTIC) and Microsoft Security Response Center (MSRC) have been credited with discovering and reporting the issue.
“Concurrent execution using shared resource with improper synchronization (‘race condition’) in Windows Kernel allows an authorized attacker to elevate privileges locally,” the company said in an advisory.
That said, successful exploitation hinges on an attacker who has already gained a foothold on a system to win a race condition. Once this criterion is satisfied, it could permit the attacker to obtain SYSTEM privileges.
“An attacker with low-privilege local access can run a specially crafted application that repeatedly attempts to trigger this race condition,” Ben McCarthy, lead cybersecurity engineer at Immersive, said.
“The goal is to get multiple threads to interact with a shared kernel resource in an unsynchronized way, confusing the kernel’s memory management and causing it to free the same memory block twice. This successful ‘double free’ corrupts the kernel heap, allowing the attacker to overwrite memory and hijack the system’s execution flow.”
It’s currently not known how this vulnerability is being exploited and by whom, but it’s assessed to be used as part of a post-exploitation activity to escalate their privileges after obtaining initial access through some other means, such as social engineering, phishing, or exploitation of another vulnerability, Satnam Narang, senior staff research engineer at Tenable, said.
“When chained with other bugs this kernel race is critical: an RCE or sandbox escape can supply the local code execution needed to turn a remote attack into a SYSTEM takeover, and an initial low‑privilege foothold can be escalated to dump credentials and move laterally,” Mike Walters, president and co-founder of Action1, said in a statement.
Also patched as part of the updates are two heap-based buffer overflow flaws in Microsoft’s Graphics Component (CVE-2025-60724, CVSS score: 9.8) and Windows Subsystem for Linux GUI (CVE-2025-62220, CVSS score: 8.8) that could result in remote code execution.
Another vulnerability of note is a high-severity privilege escalation flaw in Windows Kerberos (CVE-2025-60704, CVSS score: 7.5) that takes advantage of a missing cryptographic step to gain administrator privileges. The vulnerability has been codenamed CheckSum by Silverfort.
“The attacker must inject themselves into the logical network path between the target and the resource requested by the victim to read or modify network communications,” Microsoft said. “An unauthorized attacker must wait for a user to initiate a connection.”
Silverfort researchers Eliran Partush and Dor Segal, who discovered the shortcoming, described it as a Kerberos constrained delegation vulnerability that allows an attacker to impersonate arbitrary users and gain control over an entire domain by means of an adversary-in-the-middle (AitM) attack.
An attacker who is able to successfully exploit the flaw could escalate privileges and move laterally to other machines in an organization. More concerning, threat actors could also gain the ability to impersonate any user in the company, allowing them to gain unfettered access or become a domain administrator.
“Any organization using Active Directory, with the Kerberos delegation capability turned on, is impacted,” Silverfort said. “Because Kerberos delegation is a feature within Active Directory, an attacker requires initial access to an environment with compromised credentials.”
Microsoft on Tuesday released patches for 63 new security vulnerabilities identified in its software, including one that has come under active exploitation in the wild.
Of the 63 flaws, four are rated Critical and 59 are rated Important in severity. Twenty-nine of these vulnerabilities are related to privilege escalation, followed by 16 remote code execution, 11 information disclosure, three denial-of-service (DoS), two security feature bypass, and two spoofing bugs.
The patches are in addition to the 27 vulnerabilities the Windows maker addressed in its Chromium-based Edge browser since the release of October 2025’s Patch Tuesday update.
The zero-day vulnerability that has been listed as exploited in Tuesday’s update is CVE-2025-62215 (CVSS score: 7.0), a privilege escalation flaw in Windows Kernel. The Microsoft Threat Intelligence Center (MSTIC) and Microsoft Security Response Center (MSRC) have been credited with discovering and reporting the issue.
“Concurrent execution using shared resource with improper synchronization (‘race condition’) in Windows Kernel allows an authorized attacker to elevate privileges locally,” the company said in an advisory.
That said, successful exploitation hinges on an attacker who has already gained a foothold on a system to win a race condition. Once this criterion is satisfied, it could permit the attacker to obtain SYSTEM privileges.
“An attacker with low-privilege local access can run a specially crafted application that repeatedly attempts to trigger this race condition,” Ben McCarthy, lead cybersecurity engineer at Immersive, said.
“The goal is to get multiple threads to interact with a shared kernel resource in an unsynchronized way, confusing the kernel’s memory management and causing it to free the same memory block twice. This successful ‘double free’ corrupts the kernel heap, allowing the attacker to overwrite memory and hijack the system’s execution flow.”
It’s currently not known how this vulnerability is being exploited and by whom, but it’s assessed to be used as part of a post-exploitation activity to escalate their privileges after obtaining initial access through some other means, such as social engineering, phishing, or exploitation of another vulnerability, Satnam Narang, senior staff research engineer at Tenable, said.
“When chained with other bugs this kernel race is critical: an RCE or sandbox escape can supply the local code execution needed to turn a remote attack into a SYSTEM takeover, and an initial low‑privilege foothold can be escalated to dump credentials and move laterally,” Mike Walters, president and co-founder of Action1, said in a statement.
Also patched as part of the updates are two heap-based buffer overflow flaws in Microsoft’s Graphics Component (CVE-2025-60724, CVSS score: 9.8) and Windows Subsystem for Linux GUI (CVE-2025-62220, CVSS score: 8.8) that could result in remote code execution.
Another vulnerability of note is a high-severity privilege escalation flaw in Windows Kerberos (CVE-2025-60704, CVSS score: 7.5) that takes advantage of a missing cryptographic step to gain administrator privileges. The vulnerability has been codenamed CheckSum by Silverfort.
“The attacker must inject themselves into the logical network path between the target and the resource requested by the victim to read or modify network communications,” Microsoft said. “An unauthorized attacker must wait for a user to initiate a connection.”
Silverfort researchers Eliran Partush and Dor Segal, who discovered the shortcoming, described it as a Kerberos constrained delegation vulnerability that allows an attacker to impersonate arbitrary users and gain control over an entire domain by means of an adversary-in-the-middle (AitM) attack.
An attacker who is able to successfully exploit the flaw could escalate privileges and move laterally to other machines in an organization. More concerning, threat actors could also gain the ability to impersonate any user in the company, allowing them to gain unfettered access or become a domain administrator.
“Any organization using Active Directory, with the Kerberos delegation capability turned on, is impacted,” Silverfort said. “Because Kerberos delegation is a feature within Active Directory, an attacker requires initial access to an environment with compromised credentials.”


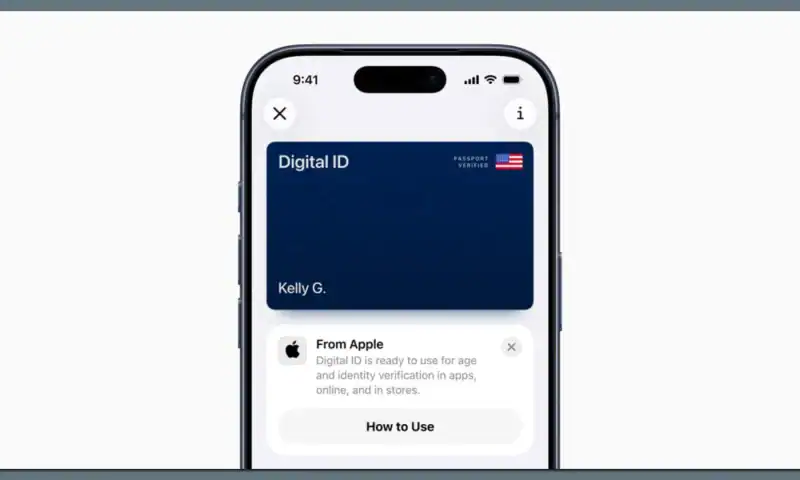
 Apple’s new passport-based Digital ID is rolling out on iPhone and Apple Watch — giving travelers a new way to clear TSA security lines with just their device.
Why it matters: It’s the biggest step yet in the tech giant’s push to make the Apple Wallet app a digital replacement for everything in your pocket — from credit cards to car keys to IDs.
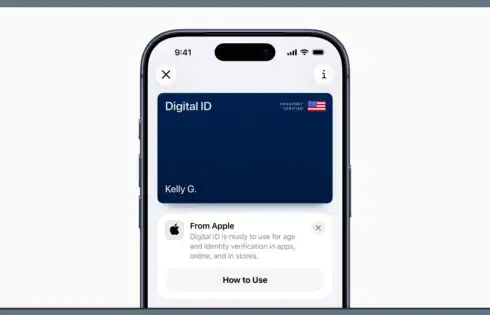
Apple’s new passport-based Digital ID is rolling out on iPhone and Apple Watch — giving travelers a new way to clear TSA security lines with just their device.
Why it matters: It’s the biggest step yet in the tech giant’s push to make the Apple Wallet app a digital replacement for everything in your pocket — from credit cards to car keys to IDs.