What Catalysts Are Shaping the Evolving Story Behind Pampa Energía

Pampa Energía has seen its Fair Value Estimate raised from ARS 4,083.17 to ARS 5,016.50, signaling a substantial upward revision in the company’s projected worth. This increase reflects newfound optimism driven by anticipated improvements in power generation and ongoing expansion in the company’s gas upstream business. Stay tuned to learn how you can keep pace with the evolving story surrounding Pampa Energía’s future prospects. Stay updated as the Fair Value for Pampa Energía shifts by adding it to your watchlist or portfolio. Alternatively, explore our Community to discover new perspectives on Pampa Energía.

What Wall Street Has Been Saying

🐂 Bullish Takeaways
  • Citi upgraded Pampa Energía to Buy from Neutral and highlighted greater confidence in the company’s growth trajectory.
  • The firm raised its price target substantially, from $92 to $113, which reflects optimism about improvements and integration between the power generation and gas upstream businesses.
  • Citi expects Pampa Energía to benefit significantly from recent changes in its power generation business and sees potential for higher monetization in the gas upstream segment.
  • Analysts cited strengthened integration across business units as a catalyst for value creation and future upside.
🐻 Bearish Takeaways
  • Current analyst commentary is largely constructive and does not present notable bearish reservations or concerns. Instead, the outlook has shifted more positively following model adjustments and recent business developments.
Do your thoughts align with the Bull or Bear Analysts? Perhaps you think there’s more to the story.
BASE:PAMP Community Fair Values as at Nov 2025

What’s in the News

  • Pampa Energía S.A. has announced a new share repurchase program, authorizing up to $100 million to buy back shares representing up to 10% of the company’s share capital.
  • The share repurchase initiative is intended to reduce the gap between the company’s fair asset value and its current market price. It also aims to enhance shareholder value and strengthen Pampa Energía’s market presence.
  • The Board of Directors officially approved the share buyback plan on September 8, 2025. This marks a strategic move to support long-term growth and investor confidence.

How This Changes the Fair Value For Pampa Energía

  • The Fair Value Estimate has increased from ARS 4,083.17 to ARS 5,016.50. This reflects a substantial upward revision in projected company value.
  • The Discount Rate has risen slightly from 23.97% to 24.22%. This indicates a modest adjustment in the company’s perceived risk profile.
  • The Revenue Growth forecast is marginally higher, moving from 12.11% to 12.15%. This signals expectations for steady business expansion.
  • The Net Profit Margin is projected to improve, rising from 23.68% to 24.27%. This points to greater operational efficiency in future periods.
  • The Future P/E Ratio has declined from 14.11x to 13.31x. This suggests that the updated valuation anticipates improved earnings relative to share price.

🔔 Never Miss an Update: Follow The Narrative

Narratives are a smarter, story-driven way to invest. They connect the numbers to a company’s real-world story, transforming financial forecasts into actionable insights and an up-to-date fair value. On Simply Wall St, millions of investors use Community Narratives to track these stories as they unfold. Narratives help you decide when to buy or sell by showing how fair value compares to market price. They are dynamically updated as new information arrives. Head over to the original Pampa Energía narrative and follow to stay up to date on:
  • How Pampa Energía’s integration of power generation and gas drives earnings growth and future value
  • The impact of Argentina’s regulatory and economic environment on company profits and risk profile
  • Up-to-the-minute updates as new projects, financials, or risks reshape the company’s fair value
‘One of the greatest misreads in modern markets’: Why hedge funder Eric Jackson thinks retail is the new smart money

Eric Jackson thinks the dumb money isn’t so dumb anymore.

The founder of EMJ Capital, Jackson is known for his contrarian takes on struggling stocks that he sees as turnaround stories. He correctly pegged ailing used car seller Carvana as a winner in 2022 and kicked off the surge in Opendoor Technologies that turned it into 2025’s meme stock sensation.

Recently, he’s been touting Palantir, even as the AI-powered data firm has struggled in recent weeks. In short, Jackson believes Wall Street is wrong, and the company’s bullish support from retail investors proves that individual traders are the new smart money.

Even after the stock dropped sharply in recent weeks following earnings, Palantir shares are still up 130% year-to-date. However, Wall Street doesn’t seem to be on board. Of the analysts that cover the stock, fewer than a third rate it a “buy,” with most rating it “hold” and 14% giving it a “sell” rating.

“Most software companies sell tools, walk away, then charge endless service fees because the tools don’t actually solve the problem,” Jackson noted. “Palantir did the opposite. They built a system with a living ontology — a real-time map of the customer’s entire world.”

In his view, analysts see Palantir as a defense contractor rather than a multifaceted software producer. He said that he believes concerns that Palantir is overvalued are unfounded.

“80× revenue isn’t crazy. It’s conservative when you understand the model,” Jackson said.

According to Jackson, while Wall Street is watching from the sidelines, retail traders have been quicker to pick up on the bullish narrative. He also said that he sees the same trend playing out with several other stocks that retail has gotten behind recently.

Jackson flagged the three companies he’s been touting this year as winners of this year’s retail-investing market.

Opendoor Technologies: +435% year-to-date.

Better Home & Finance: +534% year-to-date.

BTQ Technologies: -9% year-to-date.

BTQ is a quantum computing company that has struggled this year. However, Jackson hasn’t been touting it for as long as the other two.

Jackson recently told Business Insider that he also believes both Opendoor and Better are poised to benefit from a shift in the housing market that will come as interest rates edge down.

But Jackson is convinced that, similar to Palantir, Wall Street is misunderstanding what these companies are.

“The same pattern repeats,” Jackson stated. “Retail sees platforms. Wall Street sees products. Platforms get valued like jokes… until they get valued like inevitabilities. That arc is how the greatest 100-baggers form.”

Leaked documents shed light into how much OpenAI pays Microsoft

After a year of frenzied dealmaking and rumors of an upcoming IPO, the financial scrutiny into OpenAI is intensifying. Leaked documents obtained by tech blogger Ed Zitron provide more of a glimpse into OpenAI’s financials — specifically its revenue and compute costs over the past couple of years.

Zitron reported this week that in 2024, Microsoft received $493.8 million in revenue share payments from OpenAI. In the first three quarters of 2025, that number jumped to $865.8 million, according to documents he viewed.

OpenAI reportedly shares 20% of its revenue with Microsoft as part of a previous deal where the software giant invested over $13 billion in the powerful AI startup. (Neither the startup nor the people in Redmond have publicly confirmed this percentage.)

However, this is where things get a little sticky, because Microsoft also shares revenue with OpenAI, kicking back about 20% of the revenues from Bing and Azure OpenAI Service, a source familiar with the matter told TechCrunch. Bing is powered by OpenAI, and the OpenAI Service sells cloud access to OpenAI’s models to developers and businesses.

The source also told TechCrunch that the leaked payments refer to Microsoft’s net revenue share, not the gross revenue share. In other words, they don’t include whatever Microsoft paid to OpenAI from Bing and Azure OpenAI royalties. Microsoft deducts those figures from its internally reported revenue share numbers, according to this person.

Microsoft doesn’t break out how much it makes from Bing and Azure OpenAI in its financial statements, so it’s difficult to estimate how much the tech giant is kicking back.

Nevertheless, the leaked documents provide a window into the hottest company on the private markets today — and not just how much it makes in revenue, but also how much it’s spending in comparison to that revenue.

So, based on that widely reported 20% revenue-share statistic, we can infer that OpenAI’s revenue was at least $2.5 billion in 2024 and $4.33 billion in the first three quarters of 2025 — but very likely to be more. Previous reports from The Information put OpenAI’s 2024 revenue at around $4 billion, and its revenue from the first half of 2025 at $4.3 billion.

Altman also recently said OpenAI’s revenue is “well more” than reports of $13 billion a year, will end the year above $20 billion in annualized revenue run rate (which is a projection, not guidance on actual revenue), and that the company could even hit $100 billion by 2027.

Per Zitron’s analysis, OpenAI may have spent roughly $3.8 billion on inference in 2024. That spend increased to roughly $8.65 billion in the first nine months of 2025. Inference is the compute used to run a trained AI model to generate responses.

OpenAI has historically almost exclusively relied on Microsoft Azure to provide compute access, though it has also struck deals with CoreWeave and Oracle, and more recently with AWS and Google Cloud.

Previous reports put OpenAI’s entire compute spend at roughly $5.6 billion for 2024 and its “cost of revenue” at $2.5 billion for the first half of 2025.

A source familiar with the matter told TechCrunch that while OpenAI’s training spend is mostly non-cash — meaning, paid by credits Microsoft awarded OpenAI as part of its investment — the firm’s inference spend is largely cash. (Training refers to the compute resources needed to initially train a model.)

While not a complete picture, these numbers imply that OpenAI could be spending more on inference costs than it is earning in revenue.

And those implications promise to add to the incessant AI bubble chatter that has seeped into every conversation from New York City to Silicon Valley. If model giant OpenAI really still is in the red running its models, what might this mean for the massive investments at jaw-dropping valuations for the rest of the AI world?

OpenAI declined to comment. Microsoft did not respond to TechCrunch’s request for comment.

Does the Latest Digital Agreement Rollout Signal a Good Entry Point for DocuSign?

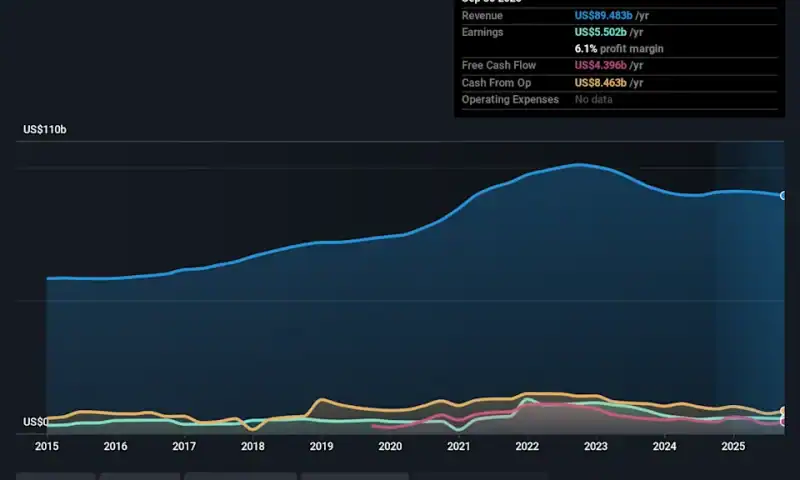
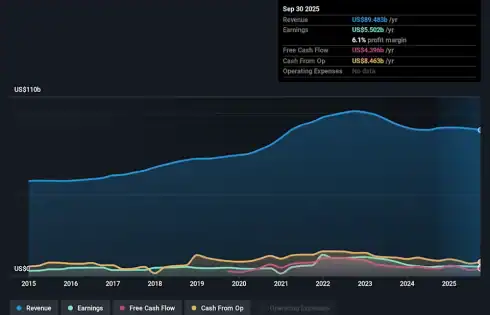
Ever wondered if DocuSign might actually be a bargain right now, or if the stock’s recent moves are just noise? Let’s dig in to find out if there’s real value beneath the surface. The stock has had its ups and downs, falling 2.8% over the past week and remaining nearly flat for the past month. However, it is down 25% year-to-date and 14.3% over the last year, with three-year returns still up 47.3%. Recent headlines have focused on DocuSign’s partnerships and its steady rollout of new digital agreement features. These developments have helped the company maintain relevance despite volatility in the broader tech sector. Investors are paying close attention to these innovations, suggesting the market could be reconsidering both risks and long-term potential. As for valuation, DocuSign scores a 3 out of 6 on our value checks, which hints at some areas of undervaluation. We will explore the typical valuation frameworks, but keep reading to see a more nuanced perspective that could make all the difference.

Approach 1: DocuSign Discounted Cash Flow (DCF) Analysis

The Discounted Cash Flow (DCF) model estimates a company’s intrinsic value by projecting its future cash flows and discounting them back to today’s value. This method helps investors understand what a business is fundamentally worth right now based on expectations for its future performance. For DocuSign, the current Free Cash Flow (FCF) stands at $938 million. While analysts provide projections for up to five years, further estimates are extrapolated for the long term. According to these forecasts, FCF is expected to reach nearly $1.2 billion by 2030, reflecting continued growth in the digital agreements market and DocuSign’s ability to generate cash. Using the DCF model, the estimated fair value per share comes out to $101.08. This valuation suggests that DocuSign is currently trading at a 33.0% discount compared to its intrinsic value, which may indicate significant undervaluation based on cash flow fundamentals. Result: UNDERVALUED Our Discounted Cash Flow (DCF) analysis suggests DocuSign is undervalued by 33.0%. Track this in your watchlist or portfolio, or discover 878 more undervalued stocks based on cash flows.
DOCU Discounted Cash Flow as at Nov 2025
Head to the Valuation section of our Company Report for more details on how we arrive at this Fair Value for DocuSign.

Approach 2: DocuSign Price vs Earnings

The Price-to-Earnings (PE) ratio is one of the most commonly used methods to assess the value of profitable companies like DocuSign. This metric makes it easy to compare how much investors are paying for each dollar of a company’s earnings, which is especially helpful for businesses that have reached consistent profitability. Generally, higher growth expectations and lower risk justify a higher PE ratio, while slower growth or higher risk should lead to a lower PE. This is because investors are willing to pay more for companies with strong future prospects and reliable earnings streams. DocuSign currently trades at a PE of 48.5x. For context, the average PE for peers stands at 48.0x, while the broader software industry’s average is lower, at 31.5x. To provide a more tailored view, Simply Wall St’s Fair Ratio for DocuSign, based on its growth rate, profit margins, market cap, industry conditions, and company-specific risks, sits at 34.4x. The Fair Ratio is designed to go beyond surface-level peer or industry comparisons. It incorporates nuanced factors such as DocuSign’s earnings growth trajectory, risk profile, and profitability. This offers a deeper perspective on what multiple the market should reasonably assign to DocuSign. Since DocuSign’s current PE is over 14x higher than its Fair Ratio, the stock appears to be overvalued on earnings fundamentals. Result: OVERVALUED
NasdaqGS:DOCU PE Ratio as at Nov 2025
PE ratios tell one story, but what if the real opportunity lies elsewhere? Discover 1405 companies where insiders are betting big on explosive growth.

Upgrade Your Decision Making: Choose your DocuSign Narrative

Earlier we mentioned that there’s an even better way to understand valuation, so let’s introduce you to Narratives. A Narrative is a simple, powerful tool that lets you combine your perspective about a company, such as what drives its future revenue, earnings, and profit margins, with the numbers to create a story-backed financial forecast and resulting fair value. Instead of relying solely on commonly accepted ratios or analyst targets, Narratives empower you to link your understanding of DocuSign’s industry position, innovation, and risks directly to financial outcomes. This approach allows you to see how your beliefs compare to current prices and decide if now is the right time to buy or sell. On Simply Wall St’s Community page, millions of investors use Narratives to visualize how changes in news, earnings, or market conditions dynamically update fair values, ensuring your viewpoint always stays relevant. For example, some investors might be especially optimistic, projecting DocuSign’s price as high as $124.0 per share driven by strong recurring revenue from AI-powered solutions and global expansion. Others remain cautious, seeing a fair value closer to $77.0 per share due to increased competition and maturing markets. Do you think there’s more to the story for DocuSign? Head over to our Community to see what others are saying!
NasdaqGS:DOCU Community Fair Values as at Nov 2025
The Safest Places To Park $5K, $10K, or $25K While Markets Slide

The Best Cash Yields Still Range Up to 5%

It’s always smart to make sure your money is earning all it could, since the right account could add hundreds more to your savings over time. The good news for savers is that today’s safe-haven options remain strong. The top high-yield savings accounts still pay up to 5.00% if you meet some requirements, or mid-4% returns for no-strings-attached accounts. Among CDs, the best nationwide rate is 4.50% right now. Brokerages, robo-advisors, and the Treasury also continue to pay attractive rates. That’s despite the Federal Reserve cutting its benchmark interest rate by a quarter point last month, following a similar cut in September—making now an opportune time to put your cash to work while rates are still high.

Why This Matters for You

Safe places for cash always exist—and right now they’re paying well. The right account can help you earn more while keeping your savings secure.

How Much Can You Earn on $5K, $10K, or $25K?

With a lump-sum savings deposit of $5,000, $10,000, or even $25,000, you can earn hundreds of dollars in interest if you choose one of today’s top rates. Whether you opt for a 3.50% cash management account, a top high-yield savings or money market account paying 5.00%, or something in between, here’s what different balances could earn over the next six months.
Six Months of Earnings at Various APYs
APY Earnings on $5K for 6 months Earnings on $10K for 6 months Earnings on $25K for 6 months
3.50% $87 $173 $434
3.75% $93 $186 $464
4.00% $99 $198 $495
4.25% $105 $210 $526
4.50% $111 $223 $556
4.75% $117 $235 $587
5.00% $123 $247 $617

Important

The rate you earn from a savings account, money market account, cash account, or money market fund is variable and will generally drop whenever the Fed cuts rates. In contrast, CDs and Treasuries allow you to lock in your yield for a set time period.

This Week’s Highest-Paying Options for Savings, CDs, Brokerages, and Treasuries

For a low-risk return that’s still rewarding, today’s top cash investment options fall into three main categories:
  1. Bank and credit union products: Savings accounts, money market accounts (MMAs), and certificates of deposit (CDs)
  2. Brokerage and robo-advisor products: Money market funds and cash management accounts
  3. U.S. Treasury products: T-bills, notes, and bonds, plus inflation-protected I bonds
You can choose a single option or mix and match based on your goals and timeline. Either way, knowing what each one is currently paying is essential. Below, we break down the top rates in each category as of Friday’s market close and how they’ve changed since last week.

Bank and Credit Union Rates

The rates below represent the top nationally available annual percentage yields (APYs) from federally insured banks and credit unions, based on our daily analysis of more than 200 institutions offering products nationwide.

Brokerage and Robo-Advisor Cash Rates

The yield on money market funds fluctuates daily, while rates on cash management accounts are more fixed but can be adjusted at any time.
Related: 6 Best Investment Accounts for Handling Uninvested Cash

U.S. Treasury Rates

Treasury securities pay interest through maturity and can be purchased from TreasuryDirect or traded on the secondary market through a bank or brokerage. I bonds must be bought from TreasuryDirect and can be held for up to 30 years, with rates adjusted every six months.

This Week’s Best Cash Rates, All in One Place

Here’s a summary look at all of the cash vehicles above, sorted by today’s highest rates. Note that the rates shown are the top qualifying rate for each product type.

How We Find the Best Savings and CD Rates

Every business day, Investopedia tracks the rate data of more than 200 banks and credit unions that offer CDs and savings accounts to customers nationwide and determines daily rankings of the top-paying accounts. To qualify for our lists, the institution must be federally insured (FDIC for banks, NCUA for credit unions), and the account’s minimum initial deposit must not exceed $25,000. It also cannot specify a maximum deposit amount that’s below $5,000. Banks must be available in at least 40 states to qualify as nationally available. And while some credit unions require you to donate to a specific charity or association to become a member if you don’t meet other eligibility criteria (e.g., you don’t live in a certain area or work in a certain kind of job), we leave out credit unions whose donation requirement is $40 or more. For more about how we choose the best rates, read our full methodology.
Warburg, Permira in talks to buy Clearwater Analytics, source says

(Reuters) -Global private equity firms Warburg Pincus ​and Permira are in talks to ‌buy investment and accounting software maker Clearwater Analytics,‌ a source familiar with the matter told Reuters on Friday.

Boise, Idaho-based Clearwater makes software that helps companies ⁠manage their investment ‌portfolios.

A deal by the two buyout firms, which helped ‍take Clearwater public in 2021, could take several weeks, the source said.

Bloomberg News ​reported on the talks earlier on ‌Friday, citing people familiar with the matter.

Warburg Pincus, Permira, and Clearwater Analytics Holdings did not immediately respond to a request for comment.

Clearwater, which ⁠went public in 2021 ​at a valuation of ​$5.5 billion, had a market capitalization of around $5.63 ‍billion as ⁠of Friday’s close, according to LSEG calculations.

A Look at Endava (NYSE:DAVA) Valuation Following New TRD U.S.A. Partnership and Quarterly Earnings Update

Endava (NYSE:DAVA) just announced it will deepen its relationship with TRD U.S.A., continuing as the motorsports company’s Official IT Consulting Partner and expanding into new circuits. This development comes at the same time as Endava’s recent quarterly results and fresh guidance, giving investors plenty to digest.

Endava’s new TRD U.S.A. partnership and recent earnings update landed just as the company’s shares slipped to $6.95, reflecting a year-to-date share price decline of 77.21%. While the expanded motorsports exposure hints at future growth, momentum remains challenged as the one-year total shareholder return stands at -76.44% and the three-year total at -91.36%. Investors appear cautious, weighing promising partnerships against recent operational headwinds.

If you’re curious where the next big winner might emerge, this could be an ideal time to broaden your radar and discover fast growing stocks with high insider ownership

Despite steep losses over the past year, Endava now trades significantly below analyst targets. Is this a long-term buying opportunity, or is the market simply reflecting persistent operational risks and muted future growth?

Most Popular Narrative: 59.3% Undervalued

Endava’s most popular narrative values the company at $17.08 per share, far above the last close of $6.95. This mismatch highlights a dramatic disconnect and a potential opportunity that investors are watching closely.

Endava’s focus on AI-enabled capabilities, such as Morpheus and Compass, positions it to leverage the digital shift. This could expand its addressable market and drive future revenue growth through AI-driven services. The company’s strategy of securing larger and longer-term deals, particularly in core modernization projects, is expected to contribute to meaningful revenue growth and stability in earnings, despite longer sales cycles.

Read the complete narrative.

Want to know what’s fueling this outsized valuation gap? Hint: The narrative hinges on bold projections about long-term profit improvement and the power of cutting-edge tech partnerships. Which financial forecast is most crucial to this story? Find out what’s behind the numbers and see why analyst consensus draws a sharp line between current prices and potential upside.

Result: Fair Value of $17.08 (UNDERVALUED)

However, slow sales cycles for AI projects and ongoing economic uncertainty in key markets could limit Endava’s expected revenue growth and margin improvement.

Build Your Own Endava Narrative

If you see things differently or want to dig deeper into the numbers yourself, crafting your own perspective takes just a couple of minutes. Do it your way

A great starting point for your Endava research is our analysis highlighting 3 key rewards and 1 important warning sign that could impact your investment decision.

Ready for More Stock Opportunities?

Smart investors always keep their radar wide. Don’t let your next great idea slip away. Simply Wall Street’s powerful screener unlocks unique investment themes and trends beyond the obvious.

  • Uncover the market’s most resilient payout opportunities and access these 15 dividend stocks with yields > 3% delivering yields above 3%.

  • Jump ahead of the curve by targeting breakthrough trends with these 25 AI penny stocks, focused on the next generation of artificial intelligence leaders.

  • Capture hidden value by seeking out these 858 undervalued stocks based on cash flows poised for growth based on real cash flow strength.

We Think You Can Look Beyond United Parcel Service’s (NYSE:UPS) Lackluster Earnings

United Parcel Service, Inc.’s (NYSE:UPS) stock was strong despite it releasing a soft earnings report last week. However, we think the company is showing some signs that things are more promising than they seem.

How Do Unusual Items Influence Profit?

To properly understand United Parcel Service’s profit results, we need to consider the US$837m expense attributed to unusual items. While deductions due to unusual items are disappointing in the first instance, there is a silver lining. When we analysed the vast majority of listed companies worldwide, we found that significant unusual items are often not repeated. And that’s hardly a surprise given these line items are considered unusual. Assuming those unusual expenses don’t come up again, we’d therefore expect United Parcel Service to produce a higher profit next year, all else being equal.

That might leave you wondering what analysts are forecasting in terms of future profitability. Luckily, you can click here to see an interactive graph depicting future profitability, based on their estimates.

Our Take On United Parcel Service’s Profit Performance

Because unusual items detracted from United Parcel Service’s earnings over the last year, you could argue that we can expect an improved result in the current quarter. Based on this observation, we consider it likely that United Parcel Service’s statutory profit actually understates its earnings potential! On the other hand, its EPS actually shrunk in the last twelve months. The goal of this article has been to assess how well we can rely on the statutory earnings to reflect the company’s potential, but there is plenty more to consider. So while earnings quality is important, it’s equally important to consider the risks facing United Parcel Service at this point in time. For instance, we’ve identified 2 warning signs for United Parcel Service (1 is concerning) you should be familiar with.

Today we’ve zoomed in on a single data point to better understand the nature of United Parcel Service’s profit. But there are plenty of other ways to inform your opinion of a company. For example, many people consider a high return on equity as an indication of favorable business economics, while others like to ‘follow the money’ and search out stocks that insiders are buying. So you may wish to see this free collection of companies boasting high return on equity, or this list of stocks with high insider ownership.

A Handful of Stocks Are Driving Most of the Market’s Gains—Again

Much has been written about how concentrated the U.S. stock market has become. The 10 largest stocks now make up about 41% of the S&P 500, the highest share in decades. Those mega-caps have driven much of the index’s gains in recent years, and that pattern continues again this year. But market concentration isn’t just about weight. Another way to look at it is through return contribution, or how much of the S&P 500’s performance comes from its 10 biggest contributors. Those stocks aren’t necessarily the 10 biggest by market cap; smaller names can punch above their weight when their prices move sharply. 
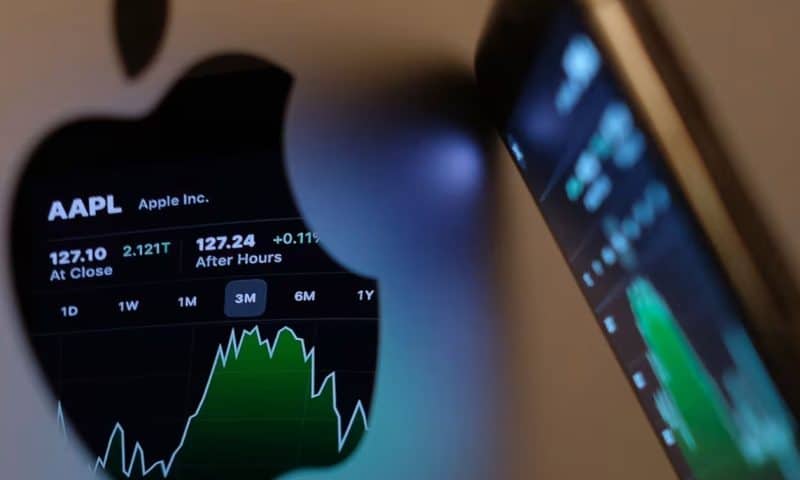
This year illustrates that well. The 10 stocks with the largest contributions account for roughly 60% of the S&P 500’s gain (about 10.5 percentage points out of the index’s 17.6% total return). That group includes the usual giants like Nvidia, Apple, Microsoft, and Alphabet, but also names further down the index, such as Palantir, AMD, and Micron Technology.
CTR
A roughly 60% share has been typical lately. In 2024, the top 10 contributors made up about 63% of the index’s return. In 2023, it was 67%. And in 2022, when the market fell 18%, the 10 biggest negative contributors accounted for 66% of the index’s losses. The last meaningful deviation from that pattern was in 2021, when the top 10 made up 43% of the S&P 500’s 12.3% gain. From 2016 through 2019, the figure hovered closer to 30%. The pandemic era turbocharged concentration. Nvidia has dominated contributions in the past two years. Apple and Microsoft traded off as the biggest drivers between 2019 and 2023. In 2018, Meta was the largest single detractor in the index. The last time a non–“Magnificent 7” stock led the market’s gains was 2016, when JPMorgan topped the contribution rankings. Back then, Apple and Microsoft were the only tech names in the top tier; financials, energy, telecom, and health care companies made up much of the rest. The data highlights how the market’s leadership has narrowed over time, and how returns have increasingly clustered in a handful of dominant stocks and sectors.
Grocery prices continue rising as holidays approach

(WHTM) — The countdown to Thanksgiving is on, and here’s what’s costing more this year.

Here at Luken Meats, customers like Regina Gertsen are buying less these days.

“Yeah, I had to cut back some because the meat is very high now,” said Regina Gertsen.

Now, a new report from Cheapism.com found that as of the end of October, coffee is now the grocery item up the most in price in 2025 — up 19%.

You’ve probably guessed the number two item: beef, up 15%. Frozen juice is up 9%, bananas are still cheap, but they are up 7% this year, and condiments are up 7%.

What’s down? Eggs: down 12%, though still pricier than they used to be. Cooking oils, down 3%, and canned tuna, down 3%.

When it comes to beef prices, it seems they only go one way, and that’s up.

The Farm Bureau blamed the low cattle inventory at its lowest level in 60 years due to drought and high feed prices. Market owner Neil Luken told us that steak and burger prices typically drop in winter, as people turn to roasts instead.

“Once we get into the holidays, the rib roast and tenderloins and that stuff will go up again.”

But that has yet to happen, as ground beef is still above $6 a pound.

That’s why President Trump has unveiled a plan to import more beef from Argentina as a solution to beef prices hitting so many families so hard.

Meantime, switching to chicken won’t save much. Richard Barlein, owner of Barlein’s Market, said the price he pays for chicken breasts and thighs has gone up over a dollar a pound this year.

“All the breasts, thighs, it has just been skyrocketing lately,” said Barlein. “Grocery prices are high now, it doesn’t matter where you go.”

While eggs and a few things are more affordable, the reality is that prices on many other grocery staples remain high.