Citi strategist: Still safe to buy the dip
Knowing when to buy and when to fold in the stock market is never an easy task. But investors won’t have to worry about whether the bears will be waking up from hibernation soon, according to a closely followed early warning system.
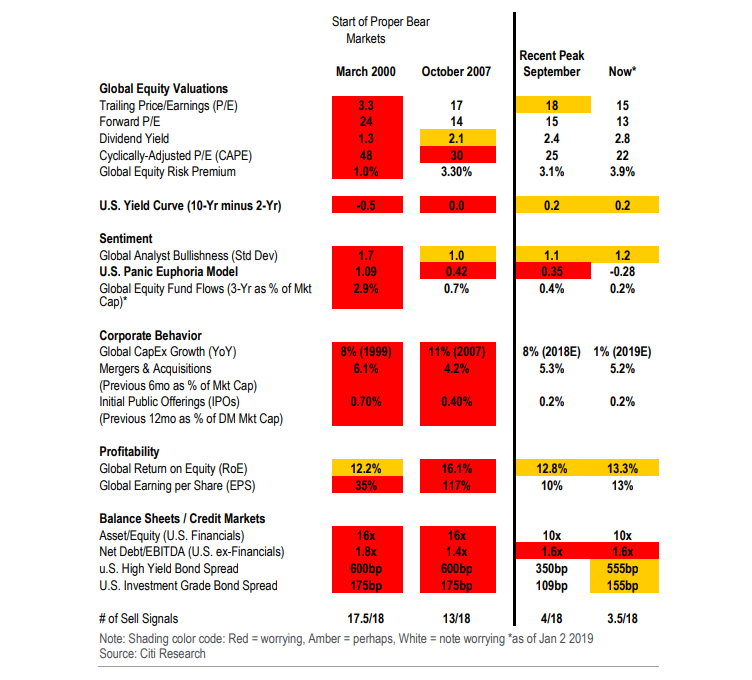
Of the 18 factors tracked by Citi, only 3.5 are flashing sell versus previous bear markets such as 17.5 in 2000 and 13 in 2007.
“For now, we are reassured,” said Robert Buckland, chief global equity strategist at Citi, in a report. “The checklist is telling us to buy this dip. Sure, returns will be lower and volatility higher, but this bull market is not finished yet.”

In the table above, indicators behaving similarly to 2000 and 2007 are colored in red, those that are “nearly there” are in amber while those that are safe are in white. To tally up the number of warning signs, red is counted as one flag while amber is equivalent to a half flag.
Stocks have logged their best start to a year since 2006 with the S&P 500 index SPX, -0.01% rallying more than 3%, the Dow Jones Industrial Average DJIA, -0.02% gaining 2.6% and the Nasdaq COMP, -0.21% jumping 5% in the first eight trading days of the year. Still, the crushing selloff in December has left many investors to question whether the market’s current rally is the real deal or a mirage.
The two most important indicators to watch are the shape of the yield curve and investment grade spreads, according to Buckland.
If the curve flattens and investment grade bond spreads widen above 175 basis points, then investors should be “more reluctant” to buy the dip, he said.
The curve—the difference in yields between the 10-year Treasury TMUBMUSD10Y, +0.00% and the 2-year Treasury TMUBMUSD02Y, +0.00% —is currently at 17 basis points and the bond spread is at 155 basis points.
The strategist also expressed some concerns over stretched corporate balance sheets and high profitability.
Still, valuations are now more reasonable than at the market’s peak in September with the the MSCI AC World index’s trailing price to earnings ratio at 15 times, below the historical median of 17, while cyclically-adjusted P/E ratio hit 22 times, also below the long-term median of 23.
Sentiment, both in the market and in the corporate sector, also suggest the market has more upside.
“We use flows into global equities as a contrarian indicator. Unsustainably high inflows usually signify unsustainably high stock markets. Reassuringly, three year inflows are still far from previous peaks as a percentage of market capitalization,” said the strategist.
Meanwhile, the pace of increase in capital expenditures remain moderate, showing an absence of C-suite exuberance. Global corporate investment are likely to rise 8% in 2018, below the double-digit growth typically seen during previous market peaks while mergers and initial public offering are comparatively subdued.
“Cautious CEOs send a reassuring signal,” Buckland said.
