Autoliv, Inc.'s (NYSE:ALV) Intrinsic Value Is Potentially 33% Above Its Share Price
Today we'll do a simple run through of a valuation method used to estimate the attractiveness of Autoliv, Inc. (NYSE:ALV) as an investment opportunity by estimating the company's future cash flows and…
From the Equity Insider archive. This article dates from Nov 30, 2025 and is preserved as first published.
Today we’ll do a simple run through of a valuation method used to estimate the attractiveness of Autoliv, Inc. (NYSE:ALV) as an investment opportunity by estimating the company’s future cash flows and discounting them to their present value. The Discounted Cash Flow (DCF) model is the tool we will apply to do this. Before you think you won’t be able to understand it, just read on! It’s actually much less complex than you’d imagine.
Remember though, that there are many ways to estimate a company’s value, and a DCF is just one method. If you still have some burning questions about this type of valuation, take a look at the Simply Wall St analysis model.
Crunching The Numbers
We are going to use a two-stage DCF model, which, as the name states, takes into account two stages of growth. The first stage is generally a higher growth period which levels off heading towards the terminal value, captured in the second ‘steady growth’ period. To begin with, we have to get estimates of the next ten years of cash flows. Where possible we use analyst estimates, but when these aren’t available we extrapolate the previous free cash flow (FCF) from the last estimate or reported value. We assume companies with shrinking free cash flow will slow their rate of shrinkage, and that companies with growing free cash flow will see their growth rate slow, over this period. We do this to reflect that growth tends to slow more in the early years than it does in later years.
Generally we assume that a dollar today is more valuable than a dollar in the future, so we need to discount the sum of these future cash flows to arrive at a present value estimate:
2026
2027
2028
2029
2030
2031
2032
2033
2034
2035
Levered FCF ($, Millions)
US$723.3m
US$773.7m
US$734.0m
US$716.3m
US$711.2m
US$714.7m
US$724.1m
US$737.8m
US$754.8m
US$774.4m
Growth Rate Estimate Source
Analyst x13
Analyst x9
Analyst x1
Est @ -2.41%
Est @ -0.71%
Est @ 0.48%
Est @ 1.32%
Est @ 1.90%
Est @ 2.31%
Est @ 2.59%
Present Value ($, Millions) Discounted @ 8.4%
US$667
US$659
US$577
US$520
US$476
US$441
US$413
US$388
US$366
US$347
We now need to calculate the Terminal Value, which accounts for all the future cash flows after this ten year period. For a number of reasons a very conservative growth rate is used that cannot exceed that of a country’s GDP growth. In this case we have used the 5-year average of the 10-year government bond yield (3.3%) to estimate future growth. In the same way as with the 10-year ‘growth’ period, we discount future cash flows to today’s value, using a cost of equity of 8.4%.
Terminal Value (TV)= FCF2035 × (1 + g) ÷ (r – g) = US$774m× (1 + 3.3%) ÷ (8.4%– 3.3%) = US$16b
Present Value of Terminal Value (PVTV)= TV / (1 + r)10= US$16b÷ ( 1 + 8.4%)10= US$7.0b
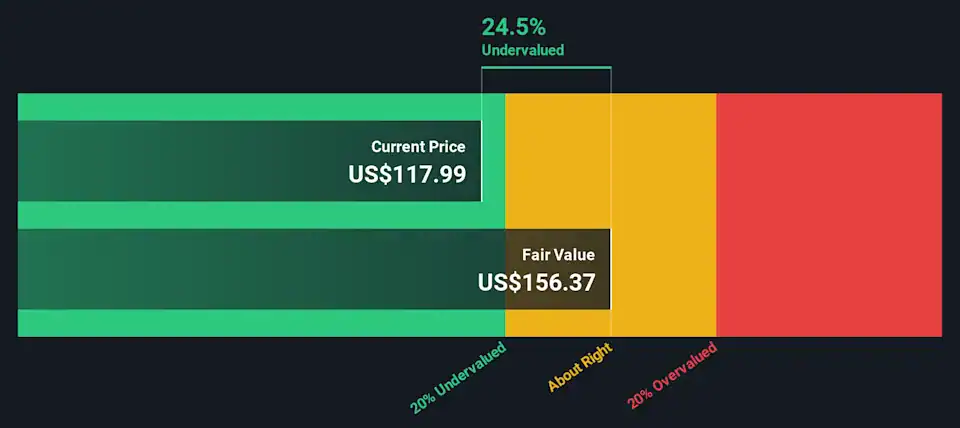
The total value is the sum of cash flows for the next ten years plus the discounted terminal value, which results in the Total Equity Value, which in this case is US$12b. The last step is to then divide the equity value by the number of shares outstanding. Compared to the current share price of US$118, the company appears a touch undervalued at a 25% discount to where the stock price trades currently. Remember though, that this is just an approximate valuation, and like any complex formula – garbage in, garbage out.
The Assumptions
The calculation above is very dependent on two assumptions. The first is the discount rate and the other is the cash flows. If you don’t agree with these result, have a go at the calculation yourself and play with the assumptions. The DCF also does not consider the possible cyclicality of an industry, or a company’s future capital requirements, so it does not give a full picture of a company’s potential performance. Given that we are looking at Autoliv as potential shareholders, the cost of equity is used as the discount rate, rather than the cost of capital (or weighted average cost of capital, WACC) which accounts for debt. In this calculation we’ve used 8.4%, which is based on a levered beta of 1.211. Beta is a measure of a stock’s volatility, compared to the market as a whole. We get our beta from the industry average beta of globally comparable companies, with an imposed limit between 0.8 and 2.0, which is a reasonable range for a stable business.