Stock Markets
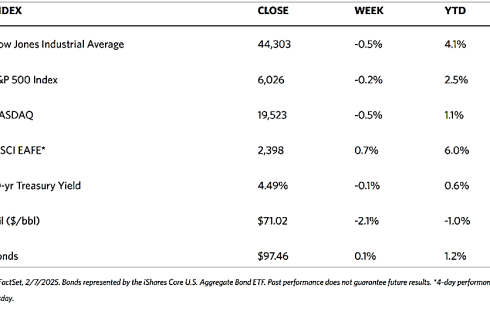
Major stock indexes fell across the board over the trading week. The 30-stock Dow Jones Industrial Average (DJIA) dipped by 0.54% while the Total Stock Market Index corrected by 0.24%. The broad S&P 500 Index lost by 0.24% and the technology-heavy Nasdaq Stock Market Composite withdrew by 0.53%. Bucking the trend is the NYSE Composite that ticked up by 0.20%. The investor risk perception indicator, the CBOE Volatility Index (VIX) moved up by 0.67%.
The week opened with a sharp decline in reaction to the announcement on the preceding Friday that President Donald Trump intends to impose 25% tariffs on imports from Mexico and Canada, and an additional 10% levy on Chinese imports effective February 1. By the end of Monday, however, President Trump announced that Mexico and Canada agreed to postpone the measure for 30 days. This provided some relief and enabled the markets to recover earlier losses by the week’s end.
U.S. Economy
Driving market activity this week were earnings-related headlines that captured investors’ attention and sentiment. More than 75% of S&P 500 Index companies that have released their fourth-quarter results through Friday have posted better-than-expected earnings with an average growth rate of 16.4%. This outshines the 11.9% earnings growth estimates according to consensus. Of the companies that have reported so far, 63% have exceeded sales expectations.
Other than company reports macroeconomic data provided some impetus to the markets. The Institute for Supply Management (ISM) Manufacturing Purchasing Managers’ Index (PMI), a measure of factory activity in the U.S., recorded expansion in January for the first time since 2022. However, optimism was somewhat quelled by the prospects that potential tariffs could pose a “huge threat” to a sustained recovery in the U.S. manufacturing sector, according to ISM Manufacturing Business Survey Chair Timothy Fiore on a call with reporters after the PMI-ISM release. Later in the week, the ISM Services PMI for January reported a 52.8 reading, and although it declined from December, it remained solidly in expansion territory.
Topping the week’s economic news was Friday’s much anticipated nonfarm payrolls report. According to the Labor Department, the U.S. economy added 143,000 jobs in January, lower than both an upwardly revised 307,000 in December and the consensus estimate of 170,000. The unemployment rate declined unexpectedly, from 4.1% in December to 4.0% in January.
Metals and Mining
The bulls are dominating in the gold market as the metal did more than hold its support at $2,800 per ounce, it rallied to a series of new record highs to ultimately touch $2,900 on Friday. The renewed momentum has once more attracted new buyers, prompting many observers to once more eye $3,000 as an attainable target. The more bullish are starting to regard $3,000 as a mere stepping stone, arguing that the market has sufficient strength to go even higher. Gold’s inflation-adjusted all-time high is approximately $3,420. The record was set in January 1980 when prices hit $875 per ounce, at the end of a four-year rally that commenced in August 1976. According to analysts, many of the factors that drove gold’s rally five decades ago are once again at play today, making the all-time inflation-adjusted record seem once more attainable. Additionally, the geopolitical uncertainties regarding global wars and trade continue to compel investors to seek security in safe-haven assets such as gold.
The spot prices of precious metals were mixed for this week. Gold rose by 2.24% from last week’s closing price of $2,798.41 to end the week at $2,861.07 per troy ounce. Silver climbed by 1.66% from its close last week at $31.30 to close at $31.82 per troy ounce. Platinum, which closed last week at $982.56, ended this week at $978.49 per troy ounce for a loss of 0.41%. Palladium closed last week at $1,016.35 and this week at $971.20 per troy ounce for a decline of 4.44%. The three-month LME prices of industrial metals were mostly higher this week. Copper jumped by 3.97% from last week’s close at $9,048.00 to this week’s close at $9,407.50 per metric ton. Aluminum edged higher by 1.31% from its close last week at $2,594.00 to end this week at $2,628.00 per metric ton. Zinc came from its close last week at $2,742.00 to its close this week at $2,840.00 per metric ton, an increase of 3.57%. Tin was priced last week at $30,102.00 and this week at $31,109.00 per metric ton for an appreciation of 3.35%.
Energy and Oil
After global concerns of a possible US-China trade war became the main talking point of the markets, Brent futures have reversed all their 2025 gains and plunged back to precisely where they began this year. In a meeting among U.S. oil executives in Houston this week, the impact of Donald Trump’s “drill baby drill” policy has been played down by these executives who warned the industry that oil production from the prolific U.S. Permian Basin would slow down by at least 25% this year. Production will rise by some 250,000 barrels per day (b/d) after a 380,000 b/d increase in 2024. In any event, the U.S. President’s enthusiasm for increasing U.S. production adds one more bearish note to the prevailing market sentiment. This backdrop sets the stage for a $2-per-barrel week-over-week decline. In the first week of February, ICT Brent is seen to settle slightly below $75 per barrel.
Natural Gas
For this report week beginning Wednesday, January 29, and ending Wednesday, February 5, 2025, the Henry Hub spot price fell by $0.07 from $3.29 per million British thermal units (MMBtu) to $3.22/MMBtu. Concerning Henry Hub futures, the March 2025 NYMEX contract price increased to $3.360/MMBtu, up by $0.19 for the week. The price of the 12-month strip averaging March 2025 through February 2026 futures contracts rose by $0.09 to $3.905/MMBtu. Natural gas spot prices fell at most locations this report week. Price changes ranged from a decrease of $3.32 at Algonquin Citygate to an increase of $0.25 at Eastern Gas South.
International natural gas futures prices increased this report week. Weekly average front-month futures prices for liquefied natural gas (LNG) cargoes in East Asia rose by $0.32 to a weekly average of $14.40/MMBtu. Natural gas futures for delivery at the Title Transfer Facility (TTF) in the Netherlands, the most liquid natural gas market in Europe, increased by $1.00 to a weekly average of $16.08/MMBtu. The weekly average TTF price has been above the weekly average East Asia price since January 13 of this year. In the week last year corresponding to this report week (beginning January 31 to February 7, 2025), the prices were $9.46/MMBtu in East Asia and $9.07/MMBtu at the TTF.
World Markets
The pan-Europea STOXX 600 Index ended 0.60% higher and just off a recent record level, despite concerns about U.S. trade policy and stalling economic growth. Major stock indexes climbed for the week. Germany’s DAX gained by 0.25%, France’s CAC 40 Index added 0.29%, and Italy’s FTSE MIB rose by 1.60%. The UK’s FTSE 100 Index advanced by 0.31%. In January, annual price growth in the eurozone remained above the European Capital Bank’s (ECB’s) target for a third consecutive month, accelerating to 2.5% from December’s 2.4%. Excluding food, energy, alcohol, and tobacco prices, core inflation held at 2.7%. Services price inflation, a closely monitored indicator by policymakers, came in at 3.9%. In the UK, the Bank of England (BoE) reduced its benchmark interest rate by a quarter point to 4.5%, the third interest rate cut since August. The Monetary Policy Committee voted 7-2 in favor of the move, citing that it had made sufficient progress on controlling inflation and wage growth. Two members supported a half-point reduction due to a sharper-than-expected economic slowdown. The BoE modified its forecast for the UK’s 2025 economic growth by half to 0.75%. In Germany, factory orders jumped by 6.9% in December, rebounding from a 5.4% drop the previous month and exceeding consensus expectations for an increase of 2.0%.
Over the week, Japanese stock markets fell. The Nikkei 225 Index dropped by 2.0% while the broader TOPIX Index lost by 1.8%. Recent hawkish comments by the Bank of Japan (BoJ) caused the yen to strengthen to rise from JPY 155.2 to the USD at the end of the previous week to the high end of the JPY 151 against the U.S. dollar range. The stronger yen weighed on the profit outlooks of the country’s export-heavy industries. On expectations of further interest rate increases by the BoJ this year, the yield on the 10-year Japanese government bond rose from the prior week’s 1.23% to 1.28%. If the economy and prices (as well as wages) develop in line with its forecasts, the bank expects to raise interest rates. The likelihood that more rate hikes will happen is supported by data showing that nominal wages rose sharply in December and the second consecutive month of positive growth in real wages (wages adjusted for inflation), although the surges were mostly due to a significant rise in companies’ winter bonuses. Separate data showed that in December, household spending rebounded by more than expected. According to the BoJ, real wages need to rise so that private consumption can follow an uptrend.
In a shortened trading week, Chinese stocks rose as evidence of strong consumer spending over the Lunar New Year holiday overcame the impact of U.S. President Trump’s decision to impose a 10% tariff on Chinese imports. The onshore benchmark CSI 300 Index rose by 1.98% and the Shanghai Composite Index gained by 1.63% from Wednesday to Friday. The mainland stock markets were closed from January 28 to February 4 for the nationwide holiday marking the Lunar New Year. The Hong Kong benchmark Hang Seng Index advanced by 4.49%. Driven by gains in technology companies, the rally was the market’s best weekly performance in four months. Over the Lunar New Year holiday, a key consumption period for China, travel and retail spending pointed to improved domestic demand. Citing data from ticketing site Maoyan, Bloomberg reported that box office receipts over the eight-day holiday jumped to $1.3 billion over last year’s holiday. According to China’s Ministry of Culture and Tourism, the volume of domestic trips rose during the holidays by a record 501 million, 5.9% higher than last year. However, although holiday sales data was solid, other data indicated weakness in the broader economy. The Caixin China General Services Purchasing Managers’ Index (PMI) dipped to 51 in January from 52.2 in December (above 50 signifies expansion, below 50 contraction). This meant that the pace of expansion in business activity and new orders both slowed to their lowest level in four months.
The Week Ahead
The CPI and PPI inflation data, retail sales data, and a host of talks by top Fed officials are among the events to look forward to in the coming week.
Key Topics to Watch
- NFIB optimism index for Jan.
- Cleveland Fed President Beth Hammack speaks (Feb. 11)
- Fed Chairman Jerome Powell testifies to Congress (Feb. 11)
- San Francisco Fed President Daly speaks (Feb. 11)
- New York Fed President Williams speaks (Feb. 11)
- Fed Governor Michelle Bowman speaks (Feb. 11)
- Consumer price index for Jan.
- CPI year over year
- Core CPI for Jan.
- Core CPI year over year
- Fed Chairman Jerome Powell testifies to Congress (Feb. 12)
- New York Fed President Williams speaks (Feb. 12)
- Atlanta Fed President Bostic speaks (Feb. 12)
- Monthly U.S. federal budget for Jan.
- Fed Governor Christopher Waller speaks (Feb. 12)
- Initial jobless claims for Feb. 8
- Producer price index for Jan.
- Core PPI for Jan.
- PPI year over year
- Core PPI year over year
- Import price index for Jan.
- Import price index minus fuel for Jan.
- U.S. retail sales for Jan.
- Retail sales minus autos for Jan.
- Industrial production for Jan.
- Capacity utilization for Jan.
- Business inventories for Dec.
- Dallas Fed President Lorie Logan speaks (Feb. 14)
Markets Index Wrap-Up