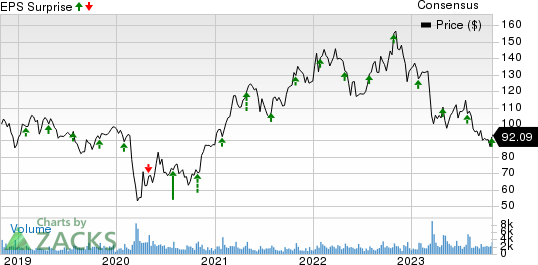
New York Community Bancorp, Inc.’s (NYCB Quick QuoteNYCB – Free Report) third-quarter 2023 diluted earnings per share, as adjusted for merger-related items, of 36 cents surpassed the Zacks Consensus Estimate by a penny. The bottom line also increased 16.1% from the prior-year quarter.
Results were primarily aided by high revenues and decent improvement in deposit balance. However, a drastic increase in expenses and a rise in provisions were headwinds. These headwinds seem to have turned investors bearish on the stock, which fell almost 2.3% following the earnings release on Oct 26.
Net income available to common shareholders, as adjusted, was $266 million, up 81% from the prior-year quarter.
Revenues & Expenses Rise
Total revenues of $1.04 billion missed the Zacks Consensus Estimate of $931.9 million. However, the top line grew drastically from $343 million year over year.
Net interest income grew substantially year over year to $882 million, mainly due to the Flagstar acquisition, which closed late last year, and the Signature transaction, which closed in late March of this year. The net interest margin (NIM) of 3.27% was up 105 basis points.
Non-interest income was $160 million, significantly up from $17 million in the year-ago quarter.
Non-interest expenses of $712 million surged drastically year over year. Total operating expenses (excluding merger-related and restructuring expenses and intangible asset amortization) increased substantially to $585 million.
The efficiency ratio was 56.15%, up from 38.57% year over year. A rise in the efficiency ratio indicates deteriorating profitability.
Loan Balance Falls & Deposit Balance Rises
As of Sep 30, 2023, total deposits decreased 6.6% to $82.7 billion sequentially. The decline was mainly due to lower non-interest-bearing deposits.
Total loans and leases held for investment rose nearly 1% to $84 billion sequentially. The growth was driven by the rise in commercial and industrial loans.
As of Sep 30, 2023, multi-family loans represented 45% of total loans, unchanged from the last quarter. Commercial loans represented 45% of total loans compared with 44% as of Jun 30, 2023. Residential loans and other loans represented 7% and 3% of total loans for this quarter, respectively.
Credit Quality Deteriorates
Non-performing assets were $404 million, which surged substantially from the figure reported as of Dec 31, 2022. Provision for credit losses was $62 million compared with provisions of $2 million in the prior-year quarter.
Net charge-offs were $24 million compared with nil charge-offs in the prior-year quarter.
Profitability Ratios Decline & Capital Ratios Improves
As of Sep 30, 2023, return on average assets and return on average common stockholders’ equity were 0.72% and 7.42%, decreasing from 0.96% and 9.01%, respectively, in the year-ago quarter.
The common equity tier 1 ratio was 9.60%, up from 9.06% as of Dec 31, 2022. The total risk-based capital ratio was 11.98%, which rose from 11.66%.
The leverage capital ratio was 7.92%, down from 9.70%.
Our View
New York Community’s efforts to expand into the BaaS space and decent loan demand are expected to support financials. Also, the acquisition of Flagstar and Signature Bank has improved its position as one of the largest regional banks and is anticipated to be earnings accretive. Yet, rising costs are likely to hamper bottom-line growth.
New York Community Bancorp, Inc. Price, Consensus and EPS Surprise


