
- Wondering whether Progressive at around US$206 still offers value or is pricing in too much optimism? This article breaks down what the current share price could be implying.
- The stock has inched up 0.4% over the last 7 days and 1.3% over the last 30 days, although it is still showing a 2.9% decline year to date and a 19.6% decline over the last year, set against longer term returns of 60.6% over 3 years and 142.0% over 5 years.
- Recent coverage has focused on Progressive’s position within the broader US insurance sector and ongoing investor debates about how to price insurance risk in the current market. This context helps explain why the share price has moved only modestly in the short term while longer term returns remain much stronger.
- On Simply Wall St’s valuation checklist, Progressive scores a 4 out of 6. This raises the question of what different valuation approaches are signaling today and whether there is an even more complete way to think about fair value that will be covered at the end of this article.
Approach 1: Progressive Excess Returns Analysis
The Excess Returns model looks at how much profit a company is expected to earn above the return required by its shareholders, then capitalizes those extra profits into an estimate of fair value per share.
For Progressive, the model uses a Book Value of $51.74 per share and a Stable EPS of $18.24 per share, based on weighted future Return on Equity estimates from 13 analysts. The Average Return on Equity is 25.60%, while the Cost of Equity is $4.97 per share, which leads to an estimated Excess Return of $13.27 per share. The Stable Book Value input is $71.26 per share, sourced from weighted future Book Value estimates from 12 analysts.
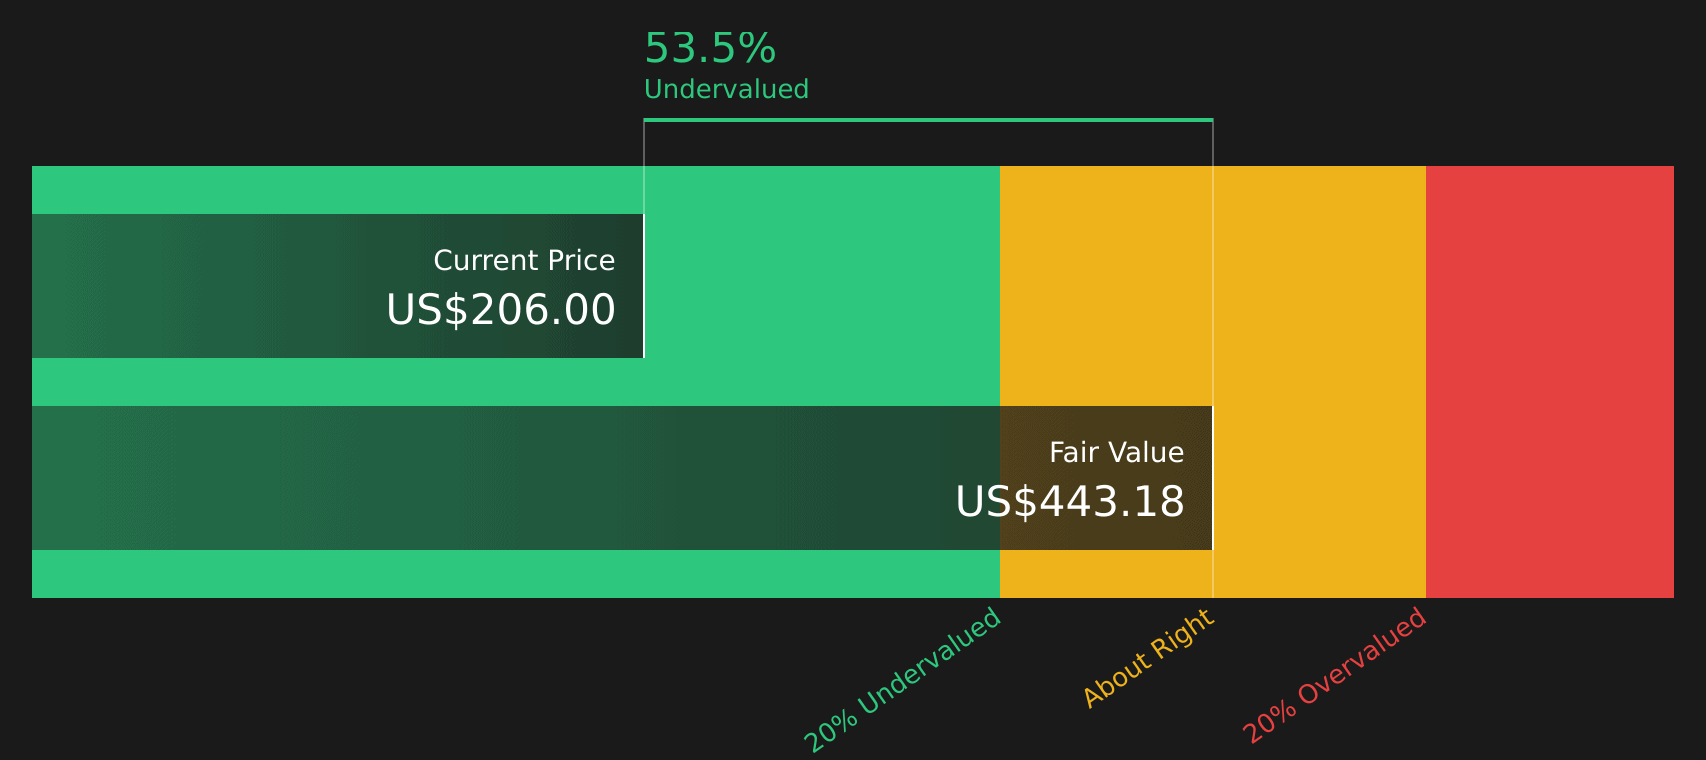
Using these inputs in the Excess Returns framework produces an estimated intrinsic value of about $443.18 per share. When compared with the current share price of roughly $206, the model indicates the stock is about 53.5% undervalued on this approach.
Result: UNDERVALUED
Our Excess Returns analysis suggests Progressive is undervalued by 53.5%. Track this in your watchlist or portfolio, or discover 52 more high quality undervalued stocks.
Approach 2: Progressive Price vs Earnings
For a profitable insurer like Progressive, the P/E ratio is a practical way to think about value because it links what you pay per share directly to the earnings the business is currently generating. Higher growth expectations or lower perceived risk can justify a higher P/E, while slower expected growth or higher risk usually call for a lower, more conservative multiple.
Progressive is trading on a P/E of 10.67x. That sits close to the broader Insurance industry average P/E of 10.79x and above the peer group average of 8.80x, which suggests the market is already assigning it a modest premium to many direct peers. To go a step further, Simply Wall St calculates a proprietary “Fair Ratio” for the P/E, which for Progressive is 11.16x. This Fair Ratio is designed to be more tailored than a simple peer or industry comparison because it incorporates factors such as earnings growth, profit margins, risk profile, market capitalization and the specific characteristics of the Insurance industry.
Comparing the current P/E of 10.67x with the Fair Ratio of 11.16x points to Progressive being slightly undervalued on this metric.
Result: UNDERVALUED

Upgrade Your Decision Making: Choose your Progressive Narrative
Earlier it was mentioned that there is an even better way to understand valuation. This is where Narratives come in, a simple way for you to connect your view of Progressive’s story with the numbers by linking your assumptions about future revenue, earnings and margins to a forecast and then to a Fair Value that you can compare with the current share price.
On Simply Wall St’s Community page, Narratives let you set out that story in an accessible format. Each Narrative becomes a living model that updates when new information such as earnings or news is added to the platform.
For example, one published Progressive Narrative uses a Fair Value of about US$399.21 based on revenue growth of 13.1%, a profit margin of 12.43% and a future P/E of 19.93. Another, more cautious Narrative uses a Fair Value of about US$191.52 with revenue growth of 5.46%, a profit margin of 9.15% and a future P/E of 15.03. Your own view might sit anywhere between those two endpoints.
For Progressive however we will make it really easy for you with previews of two leading Progressive Narratives:
Progressive Bull Case
Fair value used in this narrative: US$399.21
Implied undervaluation versus the current US$206 price: around 48.4%
Revenue growth assumption: 13.1%
- Sees Progressive’s core auto and special lines products, plus tools like Snapshot and HomeQuote Explorer, as key drivers for future premiums and earnings.
- Emphasizes a cost efficient direct sales model, use of data and underwriting track record as the core advantages against other insurers.
- Builds its higher fair value on sustained revenue growth, solid profit margins and a P/E of 19.93 applied to those future earnings.
Progressive Bear Case
Fair value used in this narrative: about US$191.52
Implied overvaluation versus the current US$206 price: around 7.6%
Revenue growth assumption: 5.46%
- Highlights risks from autonomous vehicles, climate related events, regulation and rising repair and medical costs that could pressure premiums and margins over time.
- Assumes slower revenue growth, lower profit margins and earnings of US$8.7b by about 2028, with a future P/E of 15.03.
- Frames the fair value near the lower end of analyst targets, with the current price sitting above what this more cautious set of assumptions would justify.
Your own view on Progressive can sit between these two anchors, or outside them entirely, depending on how confident you are in long term growth, pricing power and risk control.