
Market internals are still in pretty good shape
The U.S. stock market, as measured by the S&P 500 index SPX, registered new all-time intraday and closing highs on different days over the past week. Last Friday, when the market reversed downward from an all-time intraday high, it seemed to some that the top was in. But this week the S&P 500 roared back to a new all-time high after investors decided that the U.S. consumer-price index numbers weren’t all that bad.
Market internals are still in pretty good shape, although we are beginning to see weakness in one area. The S&P 500 chart has support at 5,050 (the lows of late February and early March), then at 4,983 (the bottom of the circled gap that is still on the accompanying SPX chart), and then at 4,920. There are others below that, but if the S&P 500 retreats below 4,800, that would certainly be a significant signal to the bears.
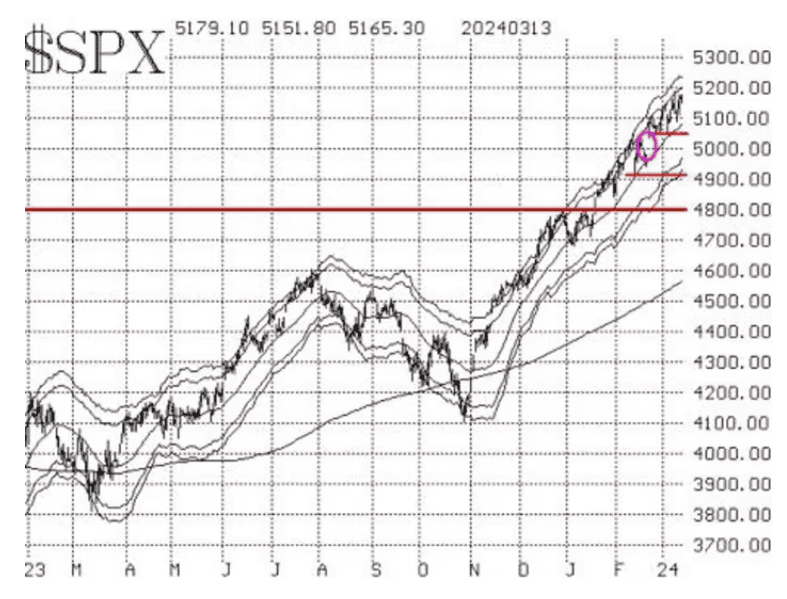
Even though the rally has been strong and continuing, the S&P 500 has not reached its 4σ modified Bollinger band (mBB), so there is technically still a possibility of a McMillan volatility band (MVB) sell signal if the index were to decline to 4,903.
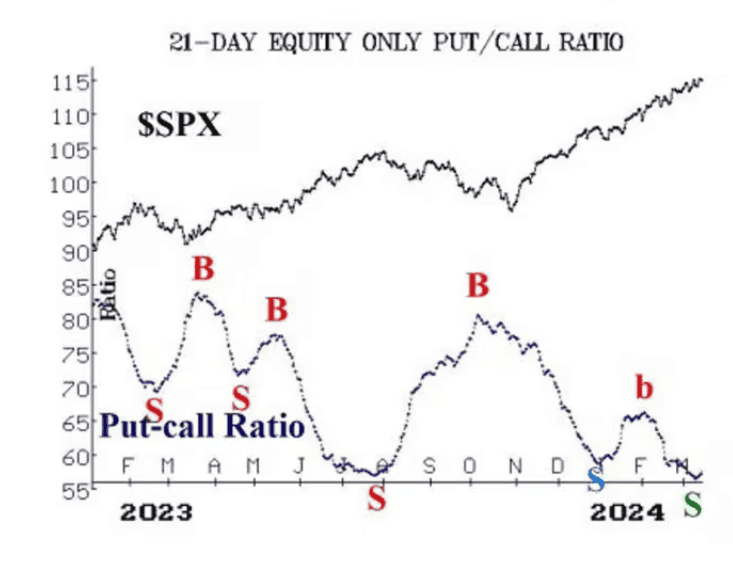
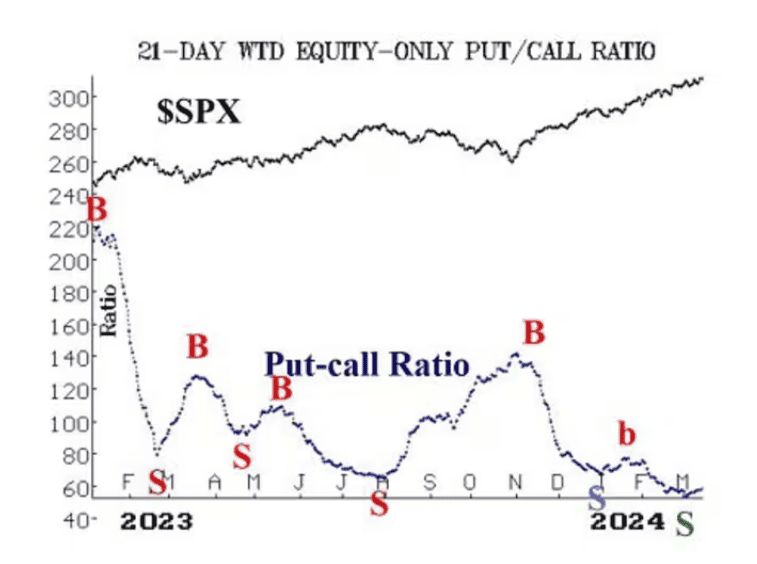
Equity-only put-call ratios have risen over the past week, despite new S&P 500 highs. This has generated sell signals for stocks, albeit tentative ones. They are marked with a green “S” on the accompanying put-call ratio charts. It would be more of a valid sell signal if these ratios were to begin to rise substantially as they did in August 2023, and that is what we would want to see before taking a bearish position here. But for now, this is the closest thing we have to a confirmed sell signal among our indicators.
Breadth has been just strong enough to keep the breadth oscillators on buy signals. It wouldn’t take a lot of negative breadth — maybe two days’ worth — to roll them over to sell signals, but so far it hasn’t happened. In addition, cumulative volume breadth has been very strong, and CVB has made new all-time highs for the last five days in a row. So, even though on some days declining issues have outnumbered advancing issues, that has not been true for volume: The volume of advancing issues has outpaced the volume of declining issues for five days in a row.
New highs on the NYSE have been robust, and they have completely swamped the number of new lows. Thus, this indicator remains strongly bullish. The buy signal will be stopped out if new lows outnumber new highs for two days in a row.
The Cboe Volatility Index VIX has dropped to the 14 level after having risen slightly in advance of the CPI report. Thus, the “spike peak” buy signal remains in place, although it is nearing its expiration. That is, the trading system that we built around these spike peaks calls for exiting the trade after 22 trading days. The signal took place 18 trading days ago, so this bullish factor (for stocks) is about to end.
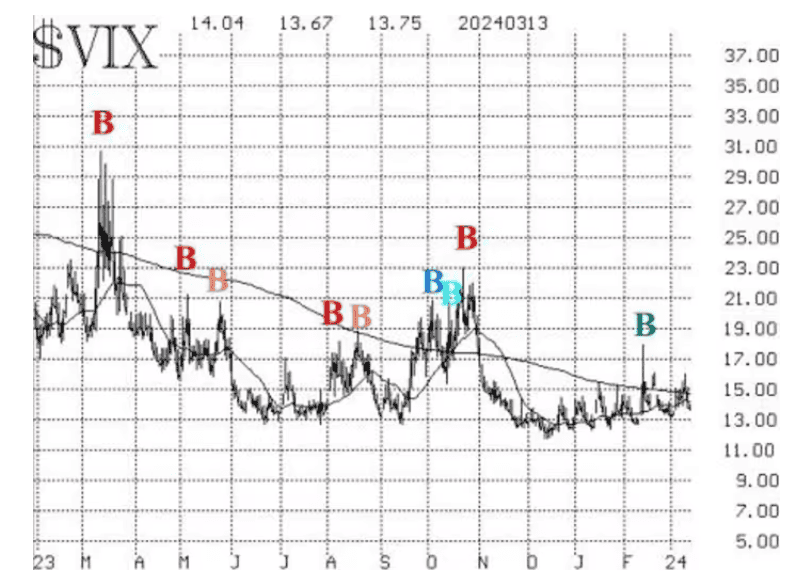
The trend of the VIX is in question right now since the VIX has been both above and below its 200-day moving average recently. As the chart above shows, the 20-day moving average of the VIX is approaching the 200-day moving average as well. If both the VIX and the 20-day moving average are above the 200-day moving average, that would be a sell signal. Again, it hasn’t happened yet, but it is certainly a possibility.
The construct of volatility derivatives remains bullish for stocks. The term structures slope upward, and the VIX futures are trading with a large premium to the VIX.
In summary, we continue to maintain our core bullish position, and we are rolling calls up to higher strikes when they become deeply in-the-money. We will trade confirmed signals around that core. Currently, there is the possibility of some new sell signals, but none have been confirmed yet.
New recommendations: Recap
For the past few weeks, we have made some conditional recommendations that have not been filled. We did get a fill on the call-buy in Apache APA, -0.28%, since the stock broke out and closed above $32.50 on March 13. However, the sell signal from MVB, and a longer-term potential buy signal from Walgreens Boots Alliance WBA, -2.04% and a put-buy in CSX Corp. CSX, -1.99%, were not.
These are all technically still valid recommendations, so we are keeping them open but will not continue to reprint the reasoning behind the trade. The recommendations themselves are stated below. If any are filled, we will address follow-up action in next week’s report. We will move on to additional recommendations as well.
1. If SPX trades at 4,903 or lower, then buy 1 SPY April (12th) at-the-money put and sell 1 SPY April (12th) put with a striking price 25 points lower.
2. If WBA closes above $22.50, then buy 4 WBA June (21st) 22.5 calls in line with the market.
3. If CSX closes below $37.50, then buy 4 CSX May (17th) 37.50 puts.
Follow-up action
We are using a standard rolling procedure for our SPDR S&P 500 ETF SPY spreads: In any vertical bull or bear spread, if the underlying hits the short strike, then roll the entire spread. That would be roll up in the case of a call bull spread or roll down in the case of a bear put spread. Stay in the same expiration and keep the distance between the strikes the same unless otherwise instructed.
Long 4 expiring XLP XLP March (15th) 73 calls: Roll to the XLP April (5th) 76 calls. Raise the trailing stop to 74.70.
Long 2 SPY March (29th) 512 calls: This position was initially a long straddle. It was rolled up, and the puts were sold. This is, in essence, our core bullish position. Roll the calls up every time they become at least 8 points in-the-money.
Long 1 SPY March (29th) 512 call: This was originally a long straddle. The put was sold, and the call was rolled up several times. Roll up every time the call is 8 points in-the-money.
Long 3 TLT TLT May (19th) 95 puts: We will hold as long as the put-call ratio sell signal is in place for U.S. Treasury bonds.
Long 1 SPY March (29th) 512 call: This call was bought in line with the new highs versus new lows buy signal. It was rolled up several times. Stop out if New York Stock Exchange new lows exceed new highs for two consecutive days. Roll up every time the call is 8 points in-the-money.
Long 2 expiring SPY March (15th) 516 calls: Bought in line with the most recent VIX spike peak buy signal. The calls were rolled up when SPY traded at 516 on March 8. Sell these calls at the close of trading on March 15 and do not replace them.
Long 4 BKR April (19th) 30 calls: Bought when Baker Hughes BKR, +0.60% closed above $30 on March 6. Continue to hold as long as the weighted put-call ratio remains on a buy signal.
Long 6 QBTS QBTS, -5.07% Apr (19th) 1.0 calls: Stop out on a close below $1.75 (raised from $1.25 last week).
Long 3 APA May (17th) 32.5 calls: Continue to hold these calls as long as the weighted put-call ratio for APA remains on a buy signal.
All stops are mental closing stops unless otherwise noted.