
EV giant’s stock dropped to a lower low, but a key momentum indicator has been trending higher for the last couple of months
Tesla Inc. bears beware: The electric-vehicle giant’s stock has bounced sharply off a 10-month low at a time the charts have been warning that momentum may have already bottomed.
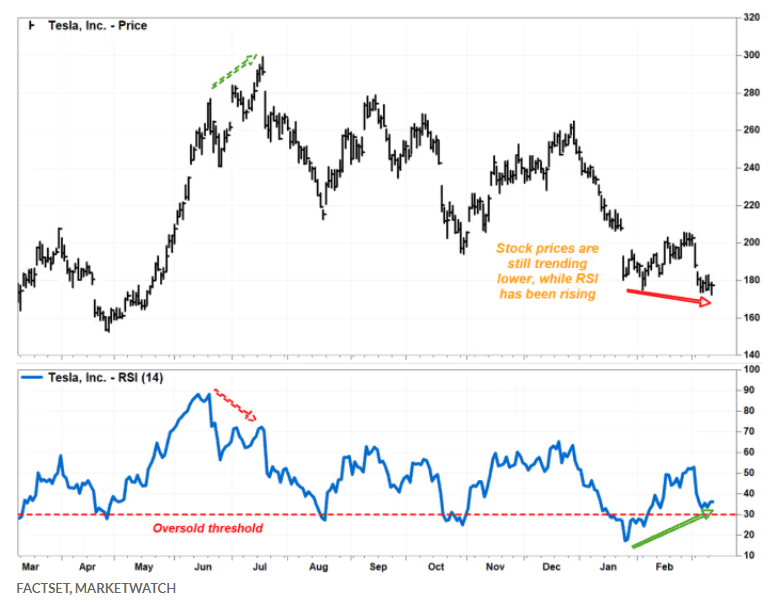
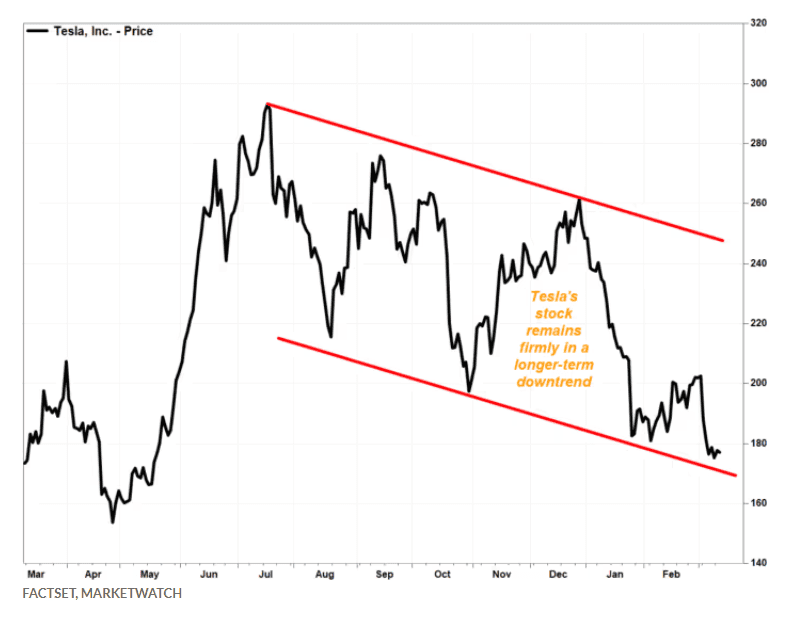
While the chart indicates that Tesla’s stock is still firmly in a longer-term downtrend, it has also been flashing a bullish technical divergence that suggests the shorter-term tide may be changing. It could now be safer to buy on the next dip than to sell on the next rally.
The stock TSLA, -0.13% was down as much as 3% at its intraday low of $172.41 — the lowest price seen since May 17, 2023 — before bouncing to be down just 0.2% in afternoon trading.
Bullish divergence refers to when a stock price continues to hit lower lows even as an underlying momentum indicator, such as the closely watched relative strength index, trends higher.
For example, Tesla’s RSI closed at a 13-month low of 17.43 on Jan. 25, when the stock tumbled 12.1% after a downbeat earnings report to close at an eight-month low of $182.63.
Meanwhile, the RSI has been rising and was last at 33.14. In fact, while the stock has continued to hit fresh lows, the RSI hasn’t been in oversold territory, or below the 30 level, since Feb. 6.
One intraday bounce doesn’t mean anything on its own, but when coupled with bullish divergence, it can act as a warning for bears to hit the pause button. In the past, when the RSI and prices have moved in different directions, RSI has usually proved to be prescient.
Keep in mind that bullish divergences are by no means a call to buy, as they can last for long periods. Rather than a market-timing signal, the divergence in Tesla’s stock chart suggests each decline has been taking more out of the bears, which could embolden bulls to push further on their next counterattack.
Since the longer-term downtrend began in mid-July 2023 with an early warning from bearish technical divergence, all the stock’s bounces have stopped short of reaching the peaks of the previous bounces. In other words, selling on rallies has paid off.
But the current divergence warns bears not to be surprised if the next bounce surpasses the previous peak. That would end the months-long pattern of lower highs that, along with lower lows, has defined the stock’s downtrend.
In the meantime, there is no sign that the longer-term downtrend is in any trouble. Oppenheimer technical analyst Ari Wald said he sees downside risk to around the $152 level — 14% below current prices — which equates to potential support at the April 2023 lows.
If there is a bounce, however, he expects trading resistance around $203, which is around the March 1 closing high of $202.64.
It would take a lot to threaten the longer-term downtrend, but a higher high, followed by a higher low on the subsequent pullback, would be a good start.