Booz Allen Hamilton Holding Corp. (BAH Quick QuoteBAH – Free Report) reported mixed second-quarter fiscal 2024 results, with revenues beating the Zacks Consensus Estimate but earnings missing the same.
Quarterly adjusted earnings per share (EPS) of $1.29 missed the consensus estimate by 1.5% and fell 3.7% on a year-over-year basis.
Strong 2023 guidance might have impressed investors as the stock climbed 2.2% since the date of earnings release on Oct 27. BAH currently projects revenue growth in the range of 11-14% compared with the prior view of 7-11%. It expects adjusted EPS in the range of $4.95-$5.10 (prior view: $4.8-$4.95). The current Zacks Consensus Estimate of $5.04 is above the midpoint ($5.025) of this EPS guidance.
Revenues, Backlog & Headcount Increase Y/Y
Total revenues of $2.66 billion beat the Zacks Consensus Estimate by 2.6% and increased 16% on a year-over-year basis. Revenues, excluding billable expenses, were $3.7 billion, up 15.5% year over year.
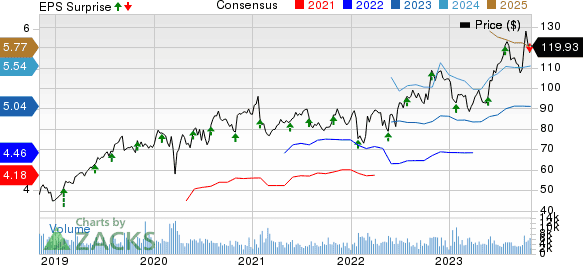
Booz Allen Hamilton Holding Corporation Price, Consensus and EPS Surprise
Total backlog increased by 10% from the prior-year figure to $35 billion. This surpassed our estimate of $33.3 billion. Funded backlog of $6.3 billion increased 14.5% year over year. Unfunded backlog declined 2.9% to $10.1 billion.
Priced options were up 16.4% to $18.6 billion. The book-to-bill ratio was 2.41, up from 2.40 a year ago. The headcount of 33,117 improved 10.3% year over year.
EBITDA Margins Rise
Adjusted EBITDA amounted to $290.6 million, up 1.6% year over year. It outshined our projection of $268.6 million. Adjusted EBITDA margin on revenue decreased to 10.9% from 12.4% in the prior year.
Key Balance Sheet & Cash Flow Numbers
Booz Allen exited the quarter with cash and cash equivalents of $557.3 million compared with $209.6 million at the prior-quarter end. Long-term debt (net of current portion) was $3.39 billion compared with $2.76 billion in the prior quarter.
The company used $47.4 million of net cash from operating activities. Capital expenditures were $16.9 million. Free cash flow was $64.3 million.
Fiscal 2024 Outlook
Adjusted EBITDA is now expected in the range of $1,115–$1,145 million compared with its prior view of $1,075 million and $1,105 million. Adjusted EBITDA margin on revenues is still anticipated in the 10-11% band. Net cash provided by operating activities is still projected in the range of $160-$260 million. The company continues to forecast the effective tax rate in the 23-25% band.