
Here’s what the historical data show
The U.S. stock market has been conspicuously calm for most of 2023, prompting some analysts to question whether investors might be overdue for a powerful jolt of volatility.
It’s been 113 trading sessions since the S&P 500 has seen a daily drop of 2% or more, the longest such stretch since Feb. 21, 2020, according to Dow Jones Market Data.
The last time the large-cap index fell by 2% or more through the close was Feb. 21, 2023, when the index dropped by 2% exactly. That was nearly six months ago.
Such subdued volatility is perhaps the most pertinent indication of just how much has changed for markets since 2022.
When measured by the total number of 2% swings in either direction, last year was the most volatile for U.S. stocks since 2009. The S&P 500 recorded 46 daily swings of 2% or more in either direction last year, compared with 55 in 2009, Dow Jones data show. Of those, roughly half were down days.
This quiet streak has been good for stocks: Since Feb. 21, the S&P 500 has gained nearly 13%, according to FactSet data. And as of Thursday, it was up more than 18% for the year.
But as August has gotten off to a rocky start, with the S&P 500 and Nasdaq Composite on track to finish lower for the first week of the month following a three-day streak of losses, some are wondering if the market might be overdue for a larger and perhaps more aggressive drop.
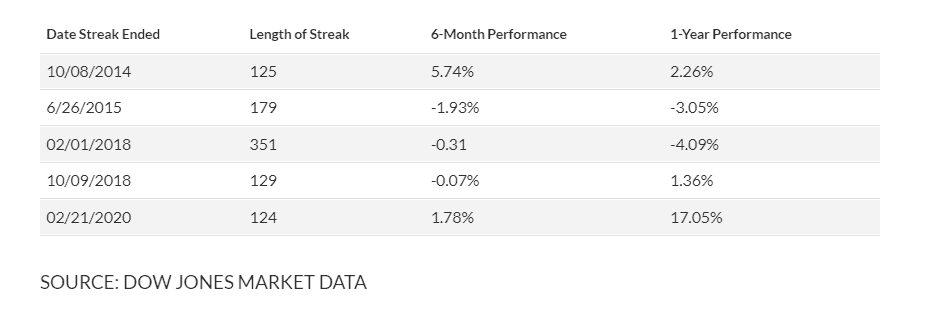
To the extent that the market’s past performance can tell investors anything useful about the future, historical data compiled by Dow Jones Market Data show that streaks of relative calm have endured for much longer in the not-too-distant past.
However, investors have often paid the price eventually.
The longest streak in recent memory without a 2% drop for the S&P 500 ended on Feb. 1, 2018 after 351 trading days — nearly 18 months. It encompassed all of 2017, a memorably tranquil year for markets that saw the Cboe Volatility Index fall to an all-time low in single-digit territory.
A few days later, stocks would see one of their biggest daily routs in years during the now-infamous “Volmageddon” episode on Feb. 5, 2018 when the Dow Jones Industrial Average fell by 1,175 points while the Cboe Volatility Index, otherwise known as the VIX, doubled, jumped by a record 20 points from 18.44 to a high of 38.40, FactSet data show.
At the time, it was the biggest daily point decline on record for the Dow. Data also show that the index has traded lower one year after the end of such streaks two out of five times.
Ryan Detrick, chief market strategist at Carson Group, said stocks might be ripe for a larger pullback in August, although he acknowledged that streaks of low volatility have often persisted for much longer.
“While these periods of low volatility can increase the odds of some type of near-term pull back, these trends can last a while,” Detrick said during a phone interview with MarketWatch.
“We might be overdue for a modest 4% to 6% pullback here, but it makes sense that this low-volatility world we’ve been living in could have legs.”
Detrick noted that 2022 saw the biggest pullback for the S&P 500 since 2008 as the index fell 19.4%, according to FactSet data.
To be sure, the selloff in the bond market was even more intense, with many analysts describing it as the worst year for bonds in decades, if not in the history of modern financial markets.
“The whole apple cart got rocked last year,” he said.
Detrick also noted that August and September tend to be more volatile months for stocks.
“The odds are higher that we could see some seasonal volatility here,” he said. “August isn’t a great month for stocks, but it’s even worse when you’ve had a good year going into it,” he said.
U.S. stocks rebounded on Friday following the release of the Labor Department’s July jobs report. The S&P 500 SPX was up 0.8% in recent trade, while the Nasdaq Composite COMP rose by 1%. The Dow DJIA was trading 256 points, or 0.7%, higher at 35,474.