Lowe’s stock has climbed back above its 200-day moving average, while Home Depot shares are still below theirs
Shares of Lowe’s Companies Inc. bounced back Tuesday to extend their bullish trend, while those of larger rival Home Depot Inc. continued their bearish bent.
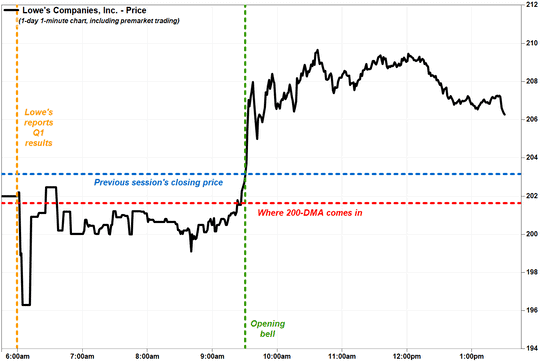
And while the stock LOW, -1.27% pared its initial loss of as much as 3.4%, it had remained on track to open below its 200-day moving average (DMA), which many Wall Street chart watchers view as a dividing line between longer-term uptrends and downtrends.
The stock initially fell in premarket trading after the home-improvement retailer reported fiscal first-quarter results before the market’s open.
But just before the bell rang at 9:30 a.m. Eastern time, the stock climbed back into bullish territory. It continued to rally and was last up 1.9% in afternoon trading at $207.06, above the 200-DMA, which currently extends to $201.62, up from $201.58 on Monday, according to FactSet.

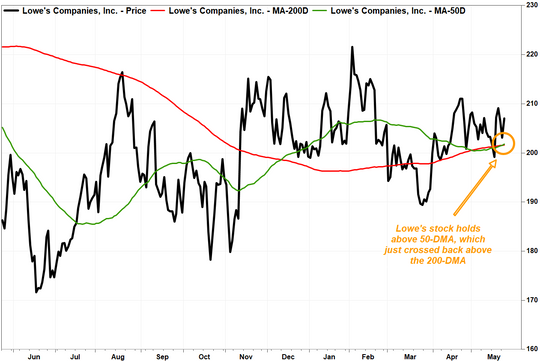
And to make the stock’s technical outlook a little more bullish, the 50-DMA, which many use to track the short- to medium-term trend, has crossed back above the 200-DMA. The 50-DMA currently comes in at $201.77, up from $201.57 on Monday.
That chart pattern is referred to as a bullish “golden cross,” which some chart watchers believe marks the beginning of a longer-term uptrend.

The golden cross isn’t necessarily a buy signal, especially since the opposite bearish “death cross” appeared just about three weeks ago. But what it does confirm to investors is that although the stock has basically gone nowhere for the past six months, that’s been enough to beat Home Depot’s stock.
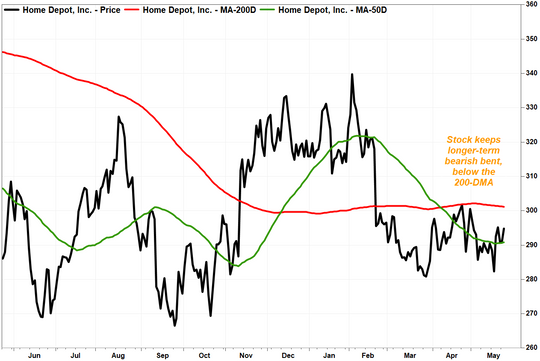
Home Depot’s HD, -1.49% stock was up 1.5% in afternoon trading Tuesday. But not only does it remain below its 200-DMA, currently at $301.16 — the stock has closed below its 200-DMA since Feb. 21 — the 200-DMA is well below the 50-DMA at $290.88.

Lowe’s stock has lost 1.9% over the past six months, while Home Depot’s has dropped 8.3%.
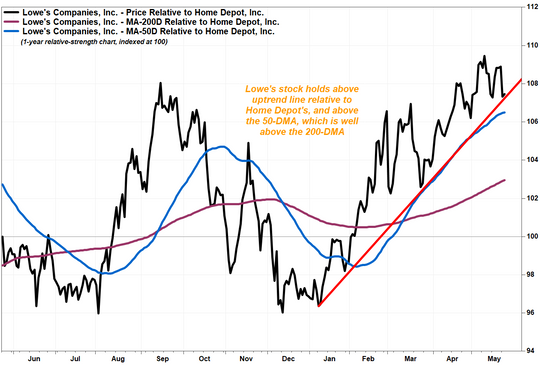
Another way to show Lowe’s outperformance is by using a relative-strength chart, which maps one stock against another:

Basically, Lowe’s stock has been holding firm to a sharp uptrend relative to Home Depot’s since the beginning of the year. And since late January, its relative performance has held above the 50-DMA, which in turn has moved well above the 200-DMA since crossing above it in mid-March.
It also helps that Lowe’s provided a fundamental reason to help back the relative uptrend.
Both companies reported fiscal first-quarter profit that beat expectations. Lowe’s also beat total sales forecasts, while Home Depot missed by a wide margin.
Both companies reported same-store sales that fell more than forecast, but Lowe’s result was better than Home Depot’s — Lowe’s was down 4.3% and Home Depot’s U.S. sales fell 4.6% — for the first time since the fourth quarter of 2020, as D.A. Davidson analyst Michael Baker noted.
And while both companies lowered their full-year profit and sales outlooks, Wall Street projections for Lowe’s earnings per share and revenue were within the company’s lowered guidance ranges.

