Watch for confirmation of these stock-market buy signals
The S&P 500 index has been struggling to break out to new highs. The internals of the market have been downright terrible, but the S&P—pretty much alone—has been pressing to new all-time highs.
This week saw the index SPX under pressure until the Federal Reserve meeting concluded and the Fed indicated that it was likely to be raising rates over the next two years.
The market liked that (ostensibly because the Fed is “ahead of the game” instead of behind it), but that seems like a curious reason to rally.
In any case, one cannot argue with the price of the market, and SPX blasted 100 points higher in less than two hours. That rally is continuing this morning, and if SPX closes above 4712, that would be a new all-time closing high, which would arguably turn the SPX chart positive once again.
I say “arguably” since last week it rallied to a new all-time closing high (at 4712) and then abruptly fell back inside the 4500-4700 trading range. The intraday high at 4744 from Nov. 22 remains unchallenged at this point.
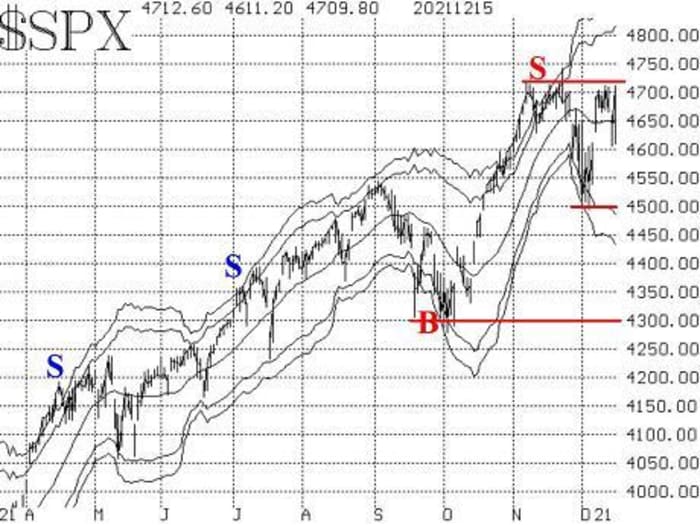
The McMillan Volatility Band (MVB) sell signal and the realized volatility (HV20) sell signal remain in effect. The S&P’s 20-day historical volatility is now up to 19%, which is quite high. It is very unusual to see HV20 increasing while SPX is making new all-time highs. But the divergences between market internals and the price of SPX itself are perhaps as wide (and negative) as they have ever been, so things such as that are becoming more commonplace.
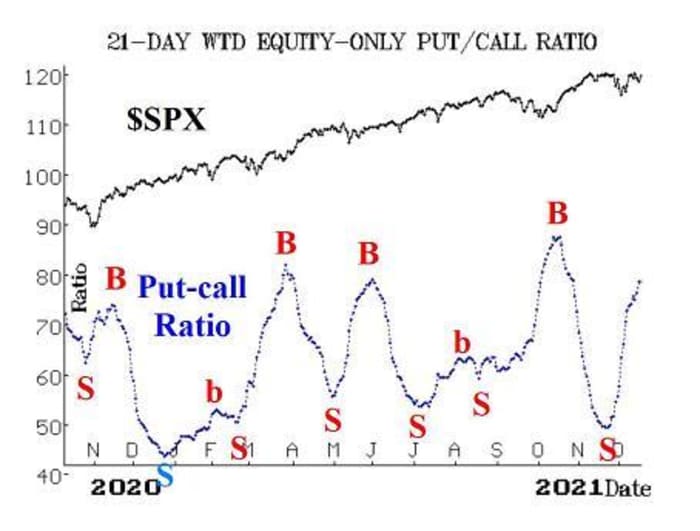
Equity-only put-call ratios remain on sell signals. The standard ratio is now at its highest level for the year (see the thin horizontal red line on the accompanying chart). That makes it oversold.
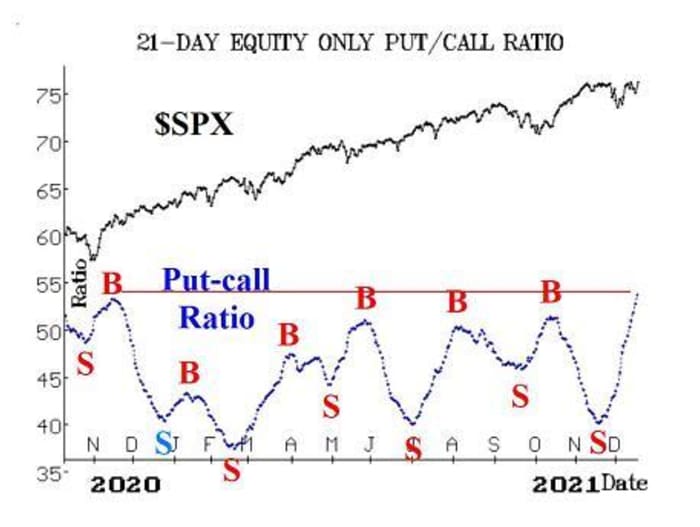
The weighted ratio has not yet reached the heights seen in October. In any case, these ratios won’t generate buy signals until they roll over and begin to decline.
Market breadth has been terrible, as most stocks are declining these days, despite the S&P’s push forward. Even the other major indexes — the NASDSAQ 100 NDX, the Dow Jones Industrial Average DJIA and the Russell 2000 RUT —are not keeping pace with SPX. But breadth has been so bad that our breadth oscillators are oversold and are not that far from setting up a confirmed buy signal.
There was a failed buy signal last week, which is not unusual to see after a massive oversold condition. However, the second buy signal is usually a strong one, so that is on the near-term horizon.
Cumulative breadth indicators are nowhere near all-time highs, so that is another negative divergence to SPX.
New 52-week lows have been swamping new 52-week highs. This is true not only for the NYSE, but also NASDAQ and our “stocks only” data set (all optionable stocks). At Wednesday’s close, SPX was within a whisper of a new all-time high yet 641 NASDAQ stocks and 938 optionable stocks (there is some overlap in those two data sets) traded at new 52-week lows.
Admittedly, most of those new lows occurred in the morning, and the market rallied in the afternoon, but still that is a big discrepancy: the index is merrily making new highs while hundred of stocks are making new lows. Not a good look for the market, even if this quantity of new lows does represent an oversold condition—albeit one which would normally be seen after a lengthy stock-market decline.
Eschewing the negativity of the above market internals, the implied volatility complex has been more in tune with a bullish argument. The VIX “spike peak” buy signal remains in effect (in fact, another, overlapping buy signal was confirmed again with Wednesday’s trading). VIX VIX has been hovering above its 200-day moving average, which is a somewhat bearish sign, but it if closes below 18.60, that would be a positive for the trend of VIX and thus a positive for SPX.
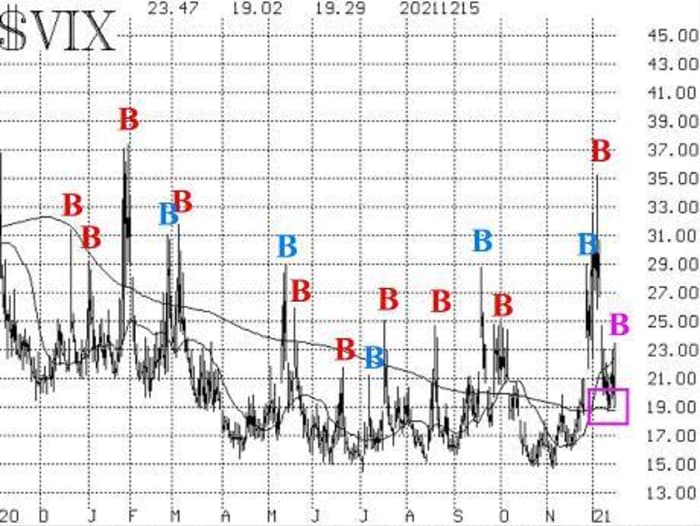
The construct of volatility derivatives has been the most bullish indicator in our arsenal. It is quite bullish right now. The December VIX futures (which expire on Dec. 22) continue to trade at prices well below those of the January VIX futures, and that is bullish. Furthermore, the term structures of the VIX futures and of the CBOE Volatility Indices continue to slope upward, and that is bullish for stocks too.
The seasonal bullish period should not be overlooked either. The Santa Claus Rally—as defined by the late Yale Hirsch many years ago—encompasses the last five trading days of one year and the first two trading days of the next. That is normally a bullish time period (if it is not, that holds further bearish implications for the market).
In summary, the S&P is in world of its own, and that world looks far more bullish than that of the “average stock.” We are seeing oversold conditions once again in the indicators that measure the health of the “average stock”—equity-only put-call ratios, breadth oscillators, and new 52-week highs vs. lows.
If those buy signals are confirmed, then there is probably more to go on the upside for SPX as we head into the end of the year.
New recommendation: Eastman Chemical
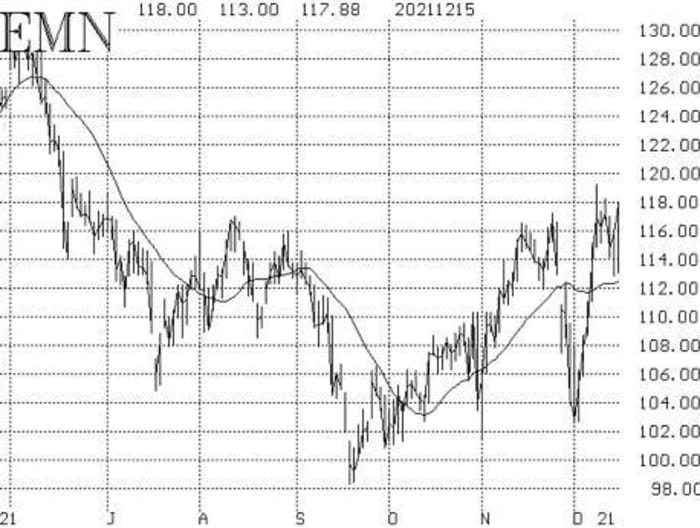
There has been heavy call buying in Eastman Chemical EMN over the past week, as vague rumors of a takeover are spreading in the marketplace.
Buy 2 EMN Jan (21st) 120 calls in line with the market.
EMN: 120.06 Jan (21st) 120 call: offered at 4.60
We will hold without a stop while these takeover rumors play out.
New recommendation: Potential buy signal from breadth oscillators
It is not going to take a lot to generate a breadth oscillator buy signal at this point. While it may not occur today, it is likely to occur relatively soon. So, use this criterion: beginning today, keep track of the running total of net advances minus declines (using NYSE data). If that running total exceeds +200 at the close of any day, then:
IF the total is above +200,
THEN buy 1 SPY Jan (7th) at-the-money call
And sell 1 SPY Jan (7th) call with a striking price 10 points higher.
As an example, suppose that on Thursday there are 1100 advances and 1400 declines, so the total would be –300. Then on Friday, suppose there are 2000 advances and 1000 declines. That is +1,000 for Friday, plus the -300 for the Thursday, for a running total of +700. At that close, the spread should be bought.
Follow-up action
All stops are mental closing stops unless otherwise noted.
Long 2 expiring ADP Dec (17th) 235 calls: The put-call ratio has finally rolled over to a sell signal, so sell these calls and do not replace them.
Long 1 expiring SPY Dec (31st) 469 put and short 1 SPY Dec (31st) 449 put: This spread was bought in line with the equity-only put-call ratio sell signals. This trade will be stopped out if the ratios begin to fall again. We will monitor the situation and report it weekly.
Long 2 expiring CMS Dec (17th) 60 calls: These were bought on Nov. 22, when the stock finally closed above 61.50. This purchased is based on the weighted put-call ratio buy signal in CMS, and that buy signal remains in effect. Roll to the Jan (21st) 65 calls.
Long 3 IWM Jan (21st) 232 calls: This is the year-end seasonal bullish trade, which is off to a poor start. For now, continue to hold without a stop.
Long 1 expiring SPY Dec (17th) 459 put and short 1 SPY Dec (17th) 434 put: This position was taken in line with the confirmed MVB sell signal of Nov. 26. It will be stopped out by a close above the +4σ Band. It will reach its target if SPX trades at the -3σ Band, which it has done. So sell this spread if you can and do not replace it.
Long 2 EXC Jan (21st) 55 puts: Hold as long as the weighted put-call ratio is on a sell signal.
Long 2 CNC Jan (21st) 70 puts: Sell these puts now since the put-call ratio has rolled back over to a buy signal.
Long 2 SPY Dec (31st) 468 puts and short 2 SPY Dec (31st) 448 puts: This is our “trading range” spread. We would take profits on half of this trade is SPX trades at 4600 or lower (it almost reached that level, but not quite).
Meanwhile, use the following as a “stop and reverse” if SPX breaks out to the upside:
IF SPX closes above 4712 on any day,
THEN sell the above spread and instead
Buy 2 SPY Dec (31st) at the money calls
And sell 2 SPY Dec (31st) calls with a striking price 10 points higher.
Long 1 IWM Jan (7th) at-the-money call: This was bought in line with several buy signals that were in effect and are once again: (VIX “spike peak,” “oscillator differential,” and breadth oscillators). Continue to hold without a stop.

