Worry instead about the impact of some newer products
Since the crash of October 1987, sharp selloffs and volatility spikes in the stock market invariably raise the same question: are computer programs the culprit?
In my experience, we should be more worried about the impacts associated with the proliferation of all kinds of new products that provide specific risk exposure to large numbers of investors, but with limited real liquidity. When sentiment shifts and everyone — whether humans or machines —– want to head for the exits through a narrow opening, the result can be these high spikes in volatility.
Machine-based trading has certainly been increasing steadily on the rise over the years, with high-frequency trading now accounting for the majority of trading volume, which itself has nearly doubled over the last decade. Critics of machine-based trading assert that it “causes” severe market moves through a cascading effect of algorithms reacting to each other very rapidly.
The opposing view is that machine-based trading actually stabilizes the market because programs typically step in when they sense even minor “price dislocations” as long as the revenue from a trade exceeds the cost of crossing the bid-ask spread plus the adverse impact from execution.
There’s some logic to both sides. But the reality is that market participants have become accustomed to the increased liquidity provided by computer programs, and its absence can result in serious withdrawal symptoms where moves can become exaggerated.
Unlike the human specialists on the New York Stock Exchange trading floor who had an obligation to step in and buy or sell especially when bid-ask spreads widened (in exchange for a healthy spread) in a relatively slow-moving market, programs have no such obligation. The razor-thin spreads associated with current markets can make it treacherous for market makers during times of stress; these new market makers can disappear quickly if the perceived risks of trading rise significantly, or widen their spreads considerably in the blink of an eye.
But what do the data tell us? Is machine-based trading causing increasingly sharp selloffs?
Causality is extremely difficult to establish. Even if we were take a complete snapshot of every trade and every quote in the market, it isn’t easy to separate machine from human roles. Humans still make many decisions, such as determining portfolio risk exposure even while the trades are executed programmatically. Still, as a first approximation, a systematic increase in intraday volatility could indicate that perhaps machines are feeding feed off each other’s panic and causing large intraday price moves. Are they?
This chart shows the average intraday swings of the S&P 500 SPX, -1.73% for each year between 1962 and 2018. The daily range has averaged roughly 1.4%. The five most volatile years in descending order, were 2008 (average range of 2.75%), 1974 (2.59%), 1980 (2.21%), 1975 (2.17%) and 1970 (2.1%). In contrast, 1987 was relatively dormant on average despite the Oct. 19 market crash, when the S&P plunged 22.6% in a single day, the most in its history.
Interestingly, 2017 saw the lowest average intraday trading range of 0.5%. This year, that has doubled to slightly over 1%, but it is still well below its historical average. The evidence at the macro level suggests that with the exception of the 2008-2009 crisis, the daily percent range has actually declined.
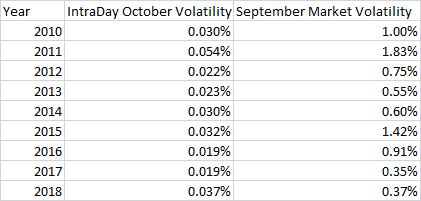
But what about swings within the day? Has this intraday volatility increased? The table below shows the intraday volatility at the one-minute level for the S&P 500 December futures contract since 2010 during the first two weeks of October every year (the numbers for November and December followed a similar pattern until last year). The table also shows the daily close-to-close volatility of the S&P 500 for each of the years during September for each year. The numbers indicate that intraday volatility during the first fortnight in October has a 66% correlation with the daily volatility in the previous month. In other words, the previous month’s volatility is a good predictor of intraday volatility for the next two weeks, with 2011 registering the highest volatility for both indicators.
This year’s intraday volatility in October has been on the higher side after a relatively calm September, but there could be a host of economic and geopolitical factors that might explain the recent market jitters. More importantly, the moves are not an outlier by historical standards.

But the numbers shouldn’t make us complacent. This year witnessed the largest-ever spike in the VIX — 112% on Feb. 5, over three times the size of the largest spike in volatility during the 2008-2009 crisis. It was caused in large part by the VelocityShares Daily Inverse VIX Short-Term ETN (XIV), which didn’t exist a decade ago and has since disappeared.
The XIV was designed to be the inverse of the VIX volatility index, but in order to minimize the costs of tethering it to the VIX, it was rebalanced at the end of each trading day since doing so continuously during the day would be very costly. On Feb 5, the XIV lost more than 80% of its value after market hours, which, as per the prospectus, triggered its liquidation.
The danger is that the proliferation of ETFs and other such vehicles used by investors to gain specific types of risk exposure can provide an illusion of liquidity in the market that may not be real. It has also introduced catalysts of volatility, often buried in the prospectuses of these ETFs, as was the case for XIV, which can catch traders by surprise. This is a major systemic risk in the market today.
While we should always be concerned about the implications of the increasing trading volumes being done by machines, perhaps we should be more concerned about the new risks posed by the introduction of vehicles in the marketplace whose behaviors and liquidity are unclear. These new Rumsfeldian “unknown unknowns” are more worrisome than machines.

