Does the February share price for Global Industrial Company (NYSE:GIC) reflect what it’s really worth? Today, we will estimate the stock’s intrinsic value by taking the expected future cash flows and discounting them to their present value. Our analysis will employ the Discounted Cash Flow (DCF) model. Believe it or not, it’s not too difficult to follow, as you’ll see from our example!
Companies can be valued in a lot of ways, so we would point out that a DCF is not perfect for every situation. Anyone interested in learning a bit more about intrinsic value should have a read of the Simply Wall St analysis model.
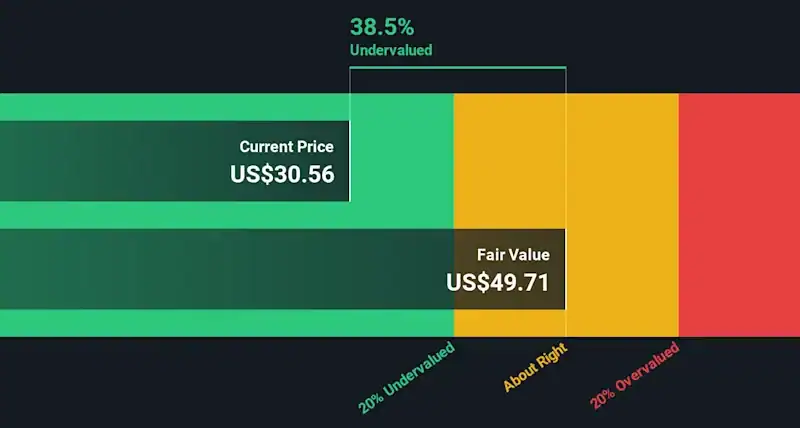
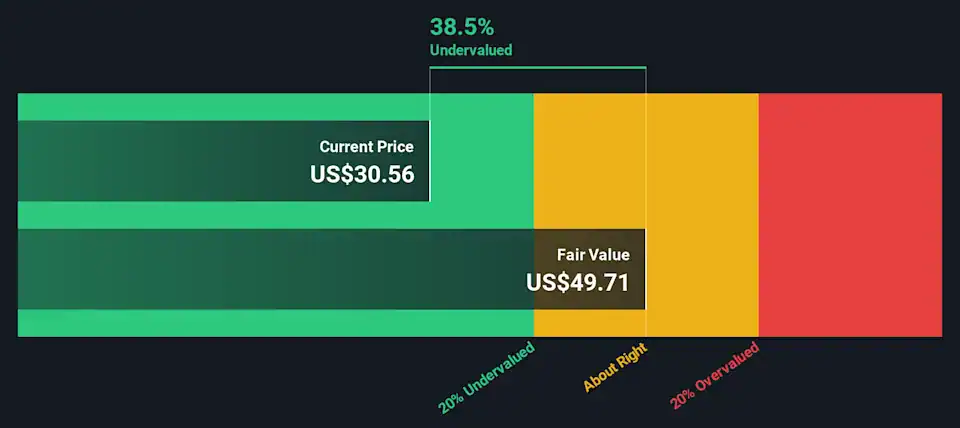
Is Global Industrial Fairly Valued?
We’re using the 2-stage growth model, which simply means we take in account two stages of company’s growth. In the initial period the company may have a higher growth rate and the second stage is usually assumed to have a stable growth rate. In the first stage we need to estimate the cash flows to the business over the next ten years. Where possible we use analyst estimates, but when these aren’t available we extrapolate the previous free cash flow (FCF) from the last estimate or reported value. We assume companies with shrinking free cash flow will slow their rate of shrinkage, and that companies with growing free cash flow will see their growth rate slow, over this period. We do this to reflect that growth tends to slow more in the early years than it does in later years.
Generally we assume that a dollar today is more valuable than a dollar in the future, so we need to discount the sum of these future cash flows to arrive at a present value estimate:
|
2026 |
2027 |
2028 |
2029 |
2030 |
2031 |
2032 |
2033 |
2034 |
2035 |
|
|
Levered FCF ($, Millions) |
US$76.5m |
US$86.3m |
US$92.9m |
US$98.8m |
US$104.2m |
US$109.1m |
US$113.9m |
US$118.4m |
US$122.9m |
US$127.4m |
|
Growth Rate Estimate Source |
Analyst x1 |
Analyst x1 |
Est @ 7.69% |
Est @ 6.36% |
Est @ 5.43% |
Est @ 4.78% |
Est @ 4.32% |
Est @ 4.00% |
Est @ 3.78% |
Est @ 3.62% |
|
Present Value ($, Millions) Discounted @ 8.1% |
US$70.7 |
US$73.8 |
US$73.5 |
US$72.3 |
US$70.5 |
US$68.3 |
US$65.9 |
US$63.4 |
US$60.9 |
US$58.3 |
(“Est” = FCF growth rate estimated by Simply Wall St)
Present Value of 10-year Cash Flow (PVCF) = US$678m
After calculating the present value of future cash flows in the initial 10-year period, we need to calculate the Terminal Value, which accounts for all future cash flows beyond the first stage. The Gordon Growth formula is used to calculate Terminal Value at a future annual growth rate equal to the 5-year average of the 10-year government bond yield of 3.3%. We discount the terminal cash flows to today’s value at a cost of equity of 8.1%.
Terminal Value (TV)= FCF2035 × (1 + g) ÷ (r – g) = US$127m× (1 + 3.3%) ÷ (8.1%– 3.3%) = US$2.7b
Present Value of Terminal Value (PVTV)= TV / (1 + r)10= US$2.7b÷ ( 1 + 8.1%)10= US$1.2b
The total value is the sum of cash flows for the next ten years plus the discounted terminal value, which results in the Total Equity Value, which in this case is US$1.9b. The last step is to then divide the equity value by the number of shares outstanding. Compared to the current share price of US$30.6, the company appears quite good value at a 39% discount to where the stock price trades currently. The assumptions in any calculation have a big impact on the valuation, so it is better to view this as a rough estimate, not precise down to the last cent.
The Assumptions
We would point out that the most important inputs to a discounted cash flow are the discount rate and of course the actual cash flows. Part of investing is coming up with your own evaluation of a company’s future performance, so try the calculation yourself and check your own assumptions. The DCF also does not consider the possible cyclicality of an industry, or a company’s future capital requirements, so it does not give a full picture of a company’s potential performance. Given that we are looking at Global Industrial as potential shareholders, the cost of equity is used as the discount rate, rather than the cost of capital (or weighted average cost of capital, WACC) which accounts for debt. In this calculation we’ve used 8.1%, which is based on a levered beta of 1.052. Beta is a measure of a stock’s volatility, compared to the market as a whole. We get our beta from the industry average beta of globally comparable companies, with an imposed limit between 0.8 and 2.0, which is a reasonable range for a stable business.