“If you buy at the (inflation) peak, you do pretty darn well over the next 12 months,” says investment strategist Jim Paulsen.
When central banks, most notably the Federal Reserve these days, move too aggressively on interest-rate increases, things break.
Believe it or not, this is bullish in the twisted thinking of Wall Street. It’s why stocks rallied earlier this week.
Before you laugh this off, consider the logic. It is not completely absurd.
Faced with a financial crisis that threatens systemic risk — because a bank or investment firm “breaks” — the Fed might well abandon the policy-tightening plan it has mapped out. This would remove the heightened risk of recession. And that would be good for stocks.
“Markets stop panicking when central banks start panicking,” says Michael Hartnett, Bank of America’s chief investment strategist.
But the best pushback on this thinking has investors selling. They think the Fed might not actually have the liberty to back off. Half of the Fed’s job is to control inflation — and headline inflation numbers tell us inflation is still raging.
“U.S. and euro-area inflation data do not allow for dovish central bank responses,” says Barclays strategist Ben McLannahan.
We can tell this bleak view is consensus because sentiment is so dark. However, this still may be wrong, which would mean you will make money if you buy stocks now.
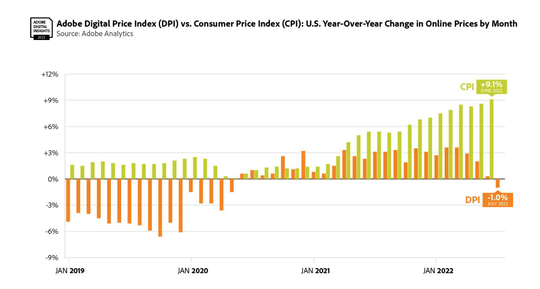
This consensus view is wrong, to me, because behind the scenes — in what I call upstream inflation numbers — we see a lot of evidence that prices are falling fast and hard. As that bleeds through to the headline Consumer Price Index (CPI) and Personal Consumption Expenditures (PCE) index that get all the attention, investors will ease up on Fed-induced recession fears. Stocks will rally.
That extreme negative sentiment caused by recession worries is also a buy signal. More on that below. But, first, here’s what history tells us about inflation spikes, and why it will be coming down faster than people think.
‘Round trips’ in inflation spikes are symmetrical
Historically, the amount of time it takes for inflation to spike is equal to the amount of time it takes for the spikes to reverse. Inflation probably peaked in March or April of this year, and it started to heat up in April 2021. This tells us the spike took a year to form, which suggests inflation will be back to levels that are not worrisome by next spring or early summer, says Jim Paulsen, an investment strategist at Leuthold, a market research group.
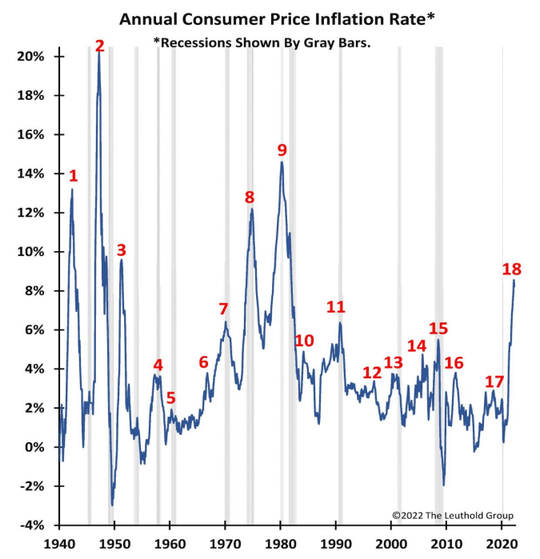
Sharp inflation spikes are excellent buy signals. In six of the seven biggest inflation spikes since the 1940s, once the CPI peaked, the low was in for the stock market.
“If you buy at the peak, you do pretty darn well over the next 12 months,” says Paulsen. Waiting until inflation is under control is not the way to go.
Take the three big inflation peaks during 1970, 1975 and 1980, an era that investors liken to the present. One year after the last two, the S&P 500 SPX, -1.02% was up over 30%. A year after the first one, it was up 8.8%. On average, stocks are up 13% one year after inflation peaks when there’s a recession, and 17% in a no-recession scenario.
Here’s are seven major trends that are about to drive that symmetrical decline in inflation.
1. Energy prices are down sharply. West Texas Intermediate crude prices CL.1, -0.12% are down 30% from June. A gallon of gasoline has fallen 23% since peaking in the same month. Energy is central to the economy, so its price has a big impact on the prices of almost everything. Plus, there is a psychological angle.
“Nothing is more central to how people think about inflation and the state of their finances more broadly than how much it costs to fill their gas tank,” says economist Mark Zandi at Moody’s Analytics.
2. Commodity prices are falling fast. The S&P Goldman Sachs Commodity Price index is down over 20% from its early June peak. Copper, steel and aluminum prices have fallen 31% to 48% since March. These are basic building blocks in the economy that go unfollowed. But the price declines are feeding through to headline inflation.
3. Rents are now dropping. A big concern is that services inflation is hot. That’s driven to a large degree by rents, which are rolling over. Follow updates from CoStar Group CSGP, +1.09%, a great source of data on real estate trends and analytics. “We’re seeing a complete reversal of market conditions in just 12 months, going from demand significantly outstripping available units to new deliveries outpacing lackluster demand,” says Jay Lybik, CoStar’s director of multifamily analytics.
4. Retailers are slashing prices to clear excess inventory. Target TGT, -0.42% grabbed headlines in early June when it reported it will have to cut prices to clear inventories. Nike NKE, -1.02% followed suit last week. Those two are not alone in over-ordering merchandise, expecting the pandemic-induced consumer preference for goods over services to continue. This inventory clearing will show up in headline inflation numbers soon.
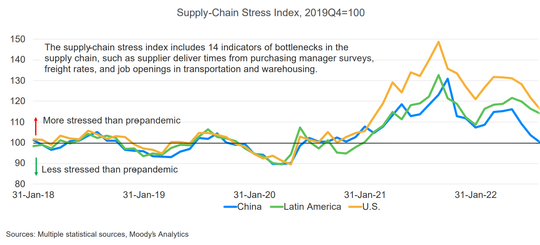
5. Supply chains are improving. Recent Fed surveys show that inventories are rising and delivery times are falling. Freight rates are down by one-third from recent highs. Monday’s Institute for Supply Management manufacturing business survey confirmed that order backlogs fell by 2.1 percentage points compared to August. Inventories also rose, indicating an easing of supply chain congestion. The Goldman Sachs Analyst Index also suggests that supply chain disruptions continued to moderate in September. Fewer analysts are reporting their sectors are experiencing supply constraints and more report rising inventories. All of this tells us that supply-chain problems — a big source of inflation — are easing.
6. Businesses are failing to raise prices. September data show that company sales are hanging in there but profit margins peaked in early June and slipped slightly in mid-September. “Companies are finding it harder to pass their rising costs through, as evidenced by the weakness in the profit margin recently,” says Ed Yardeni of Yardeni Research. Meanwhile, tech companies are back to their long-standing deflationary ways, putting downward pressure on prices again.
7. Labor market dynamics are improving. The Bureau of Labor Statistics on Tuesday reported over one million fewer job openings than expected for August, down to 10 million from 11.2 million reported in July. This was the biggest one-month decline since April 2020. This suggests the labor market pressure is starting to ease, which reduces upward pressure on wages — one half of the dreaded “wage price spiral.”
Why this matters for stocks
“Just the perception that the Fed is done raising rates would be enough to mark the bottom in the bear market and lead to a sustainable rally,” says Yardeni. Declining inflation will also boost consumer confidence, helping to avert a severe recession, if one occurs. We already see this happening.
The Bank of America consumer confidence indicator increased to a five-month high of 33.7% as of Sept. 25, compared to a trough of 27.6% in early July. “Consumers are feeling more optimistic about the economy as significantly lower gas prices have somewhat eased inflation concerns,” says Bank of America. The September University of Michigan Consumer Sentiment report was at its highest level since April.
Extreme negative sentiment ‘buy’ signal
The market certainly seems primed for a good rally. Investors are extremely bearish, a bullish signal in the contrarian sense. The Investors Intelligence Bull Bear ratio recently came in at 0.61, an unusually bearish read. Any readings below one historically suggests good entry points into stocks.
The American Association of Individual Investors sentiment poll released Sept. 29 showed only 20% of respondents were bullish, compared to 60.8% who were bearish. This put the bear-bull ratio at three, a high that has been reached just three times since this survey began in July 2008, says Oppenheimer chief investment strategist John Stoltzfus. “This suggests to us that bearish sentiment is at an extreme,” he says.
Bank of America is still cautious on stocks but a lot of the bank’s sentiment indicators are solid buy signals. Its proprietary bull and bear indicator is pegged at 0. That is maximum bearish, but maximum bullish in the contrarian sense. Bank of America also notes that fund managers it surveys have cash at 6.1% of their assets. Historically, the market is a buy when cash levels are at 5% or above.