Stock Markets
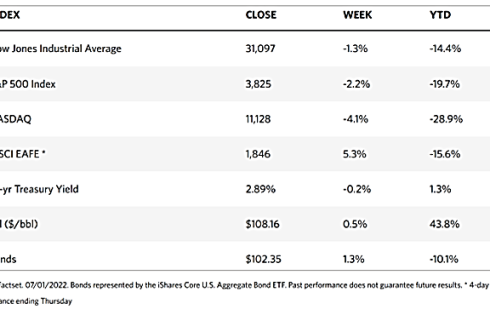
Over the week just concluded, the stock markets showed took a further dip ahead of a long holiday weekend. The Dow Jones Industrial Average (DJIA) closed 1.28% lower week-on-week with all sectors down except for the utility sector which managed to average 4.09% up. The S&P 500 Index closed 2.21% down, while the Nasdaq stock market composite also slid 4.13%. The New York Stock Exchange (NYSE) Composite lost 1.18% for the week. The slight pullback may be seen as a correction following the strong gains over the preceding week. It may also be attributed to worries that the Federal Reserve’s aggressive attempts to control inflation may push the economy into a full recession. The S&P 500 suffered its worst first semester since 1970, with the decline being highlighted by the index ascending to its all-time high on January 3 this year. Those segments within the index regarded as typically defensive, namely utilities and consumer staples, were most resilient, while information technology and consumer discretionary shares were the weakest. The market will remain closed on Monday in celebration of the Fourth of July, Independence Day. Inflation worries remain front and center for investors, but the financial sector seems to be looking ahead to a potential economic slowdown or likely recession.
U.S. Economy
A survey of the four financial markets – equities, bonds, commodities, and currencies – appears to be signaling a slowdown in economic growth ahead, although this may be part of a bottoming process. Market reactions are forward-looking and tend to be leading indicators, with market corrections followed by slowing economic data and a downward revision in earnings data. There are already signs of economic fundamentals softening in the form of a simultaneous descent in consumer confidence, PMIs, and retail-sales data. In the months ahead, earnings forecasts are likely to be adjusted downwards, resulting in the formation of a more rounded U-shaped bottom, rather than a sharp V-shaped curve.
In the meantime, most of the economic data released during the week fell short of consensus expectations. The week’s sell-down began on Tuesday just as the Conference Board’s index of consumer confidence registered much lower than expected. Also, manufacturing activity metrics in the mid-Atlantic region plummeted to levels not seen since the peak of the pandemic. Data on May personal consumption expenditures (PCE) were released on Wednesday, also indicating that consumers were also retreating. May purchases fell 4.0% when adjusted for inflation, the first time this important indicator declines in 2022. The move was driven by a 1.6% decline in good purchases, and while purchases of services rose a marginal 0.3%, much of the increase was propelled by spending on housing and health care. Inflation-adjusted disposable income reported on Thursday saw a decrease of 0.1% over the month.
There were still some welcome developments, however. Much of the week’s data pointed towards a lowing but continued expansion. May durable goods orders were better than expected when controlling for defense (0.6% versus approximately -0.5%). Measures of current factory activity pointed to continued expansion, albeit at the slowest rate since summer 2020. Weekly jobless claims aligned roughly with expectations at 231,000, as the indicators continued within the narrow band between 231,000 to 232,000 that had been maintained for four consecutive weeks. Claims hit their lowest at 181,000 for the week ended April 24. The silver lining that greeted investors, however, was a downside surprise in inflation signals. The inflation gauge preferred by the Fed is the core PCE price index (discounting food and energy), which came in at 4.7% for the 12 months ending May, slightly below expectations and the lowest level since November. Together with the sluggish economic data, this yelped push the 10-year U.S. Treasury Note benchmark yield to as low as 2.79% on Friday, its lowest level in a month, resulting in higher bond prices.
Metals and Mining
The gold market continued to tread above its strong support at $1,800 per ounce, but only barely after a sharp selloff early on Friday. Recession fears continued unabated together with geopolitical instability, equity market volatility, and inflation pressures, prompting investors to hold gold as a safe haven asset. The market appears convinced, however, that interest rates are likely to proceed upward for the rest of the year, making gold unattractive because it promises no yield. More tough talk from Federal Reserve Jerome Powell convinced investors that he is willing to risk a recession in an attempt to control inflation by raising interest rates. A further downside in gold is indicated by Friday’s preliminary data showing the European Consumer Price Index rising to 8.6% in June, overshooting the 8.1% rise in May and higher than the expected 8.4%. This foreshadows growing pressure on the ECB to start increasing rates and the markets are pricing in a rate hike later this month.
Gold moved sideways from its previous close at $1,826.88 to this week’s $1,811.43 per troy ounce, down slightly by 0.85%. Silver came down 6.05%, from last week’s close at $21.16 to this week’s close at $19.88 per troy ounce. Platinum also went south from $911.08 to $892.74 per troy ounce, a downward correction of 2.01%. Palladium bucked the trend for precious metals, beginning at $1,882.75 and closing the week at $1,959.58, up by 4.08%. Among 3-mo prices of base metals, copper, which previously closed at $8,381.00, went further down to $8,048.00 per metric tonne, losing 3.97%. Zinc came from $3,350.00 to end at $3,029.00 per metric tonne for the week, down by 9.58%. Aluminum closed the previous week at $2,456.00 and this week at $2,444.00 per metric tonne, only slightly down by 0.49%. Tin came from $24,590.00 to close this week at $26,650.00 per metric tonne, a week-on-week gain of 8.38%.
Energy and Oil
Uncertainty continues to build around OPEC+ supply capacity as demand continues to rise unabated despite speculations of demand destruction. OPEC+ in its recent summit greed to maintain a 648,000 barrel per day increase in its August production target. This has kept its commitment unchanged despite the increasing evidence that the oil group’s spare capacity has thinned to its lowest level in years. Oil markets are buoyed by bullish sentiments, driven further by an additional supply disruptor in the form of strikes. At France’s Fos Refinery, operations were halted by strikes. Norway’s offshore production was similarly heavily impacted. The oil market is seemingly under siege from all directions, including fundamental tightness, underinvestment, Ukraine ware disruptions, and now, work stoppages due to labor disputes.
Natural Gas
For this report week, June 22 to June 29, natural gas spot price movements were mixed. The Henry Hub spot price rose to $6.67 per million British thermal units (MMBtu) by the week’s end, from $6.59/MMBtu at the beginning of the week. Also increasing this report week are international spot prices, with the weekly average swap prices for liquefied natural gas (LNG) cargoes in East Asia increasing by $4.58 to a weekly average of $36.87/MMBtu. In the Netherlands at the Title Transfer Facility (TTF), Europe’s most liquid natural gas spot market, the day-ahead price increased by $3.29 to a weekly average of $40.37/MMBtu. The price for the same week last year (week ending June 30, 2021) in East Asia was $12.75/MMBtu and $11.57/MMBtu at TTF.
In the U.S., prices rose slightly along the Gulf Coast even as temperatures moderated. In the Midwest, prices remained essentially unchanged while temperatures fluctuated. Prices across the West are mixed, with above-normal temperatures across the Rocky Mountains and along the coast. Along with temperatures and demand for natural gas, Northeast prices increased. U.S. natural gas supply increased slightly week over week, while the country’s natural gas demand remained unchanged, as changes in demand across consumption sectors offset each other. U.S. LNG exports decreased by one vessel this week from last week.
World Markets
European stock markets lost ground on continuing fears that inflation will continue to rise unabated, with the resultant increase in interest rates hitting earnings and tipping economies into a recession. The pan-European STOXX Europe 600 Index closed the week 1.40% lower in local currency terms. Italy’s FTSE MIB plunged 3.46%, France’s CAC 40 dropped 2.34%, and Germany’s DAX Index lost 2.33%. The UK’s FTSE 100 Index dipped 0.56%, supported by a softer British pound against the U.S. dollar. When the pound falls, UK stocks tend to perform comparably well since many companies that form part of the FTSE 100 Index are multinational companies reaping revenues from overseas markets, rendering their earnings more resilient. Core eurozone bond yields decreased in reaction to speeches by central bank officials at the European Central Bank (ECB) annual meeting, reversing their initial increase. Lower-than-expected German inflation figures calmed investors’ fears, leading yields lower overall. UK government and peripheral eurozone bond yields tracked core markets in general.
Japan’s stock markets followed the direction of other international bourses this week, The Nikkei 225 Index lost 2.10% and the broader TOPIX Index fell 1.16%. The slump was due to the escalating risk of a global recession resulting from the aggressive rate hikes by the world’s major central banks in a bid to control inflation. Japan’s large manufacturers are growing increasingly pessimistic and a bigger-than-expected drop in industrial production further weighed down investor sentiment. In the meantime, the Japanese government warns of power shortages and possibly a renewed reliance on nuclear reactors for energy supply. In light of this, the yield on the 10-year Japanese government bond ended the week broadly unchanged at 0.23%. The yen still hovers close to a 24-year low against the U.S. dollar, a weakness that may be attributed to the divergent monetary policies of the Bank of Japan and the U.S. Federal Reserve. The exchange rate ended the week at the low end of the JPY 135 range. Factory output falls sharply as sentiment among large manufacturers worsens.
China’s stock markets charted gains, prompted by strong factory data and easing coronavirus restrictions for travelers. The broad, capitalization-weighted Shanghai Composite Index rose 1.3%. The blue-chip CSI 300 Index, which monitors the largest listed companies in Shanghai and Shenzhen, climbed 1.6%. On Tuesday, China reduced by half the quarantine times for inbound travelers. The new policy requires travelers to spend seven days in a quarantine facility after which their health should be monitored at home for three days. This is a vast improvement over the 14 days previously required for hotel quarantine in many parts of the country, and as many as 21 days of solation in the past. The current pandemic strategy, according to China’s President Xi Jinping, was “correct and effective and must be upheld unwaveringly.” The yuan currency depreciated to CNY 6.70 against the U.S. dollar late Friday, from CNY 6.69 the week before. The 10-year Chinese government bond yield rose slightly from 2.816% to 2.847% week-on-week as issuance increased. The sale of Chinese local government bonds for June is expected to reach a single-month record high of CNY 1.93 trillion.
The Week Ahead
Unemployment, average hourly earnings, and consumer credit are among the important economic data to be released this week.
Key Topics to Watch
- Factory orders
- Core capital equipment orders revision
- S&P Global U.S. services PMI (final)
- ISM services index
- Job openings
- Quits
- FOMC minutes
- Initial jobless claims
- Continuing jobless claims
- Foreign trade balance
- Louis Fed President James Bullard speaks
- Fed Gov. Christopher Waller speaks at NABE conference
- Nonfarm payrolls (monthly change)
- Unemployment rate
- Average hourly earnings
- Labor force participation rate, ages 25-54
- Wholesale inventories revision
- Consumer credit
Markets Index Wrap Up