If history is a guide, bitcoin at $5,500 could prove to be a bargain
It may seem like catching a falling knife — but for those brave enough — now might be an opportune time up pick up some bitcoin on the cheap.
This chart comes from Twitter user @OddStats, who put together a chart of bitcoin and plotted significant two-day selloffs:
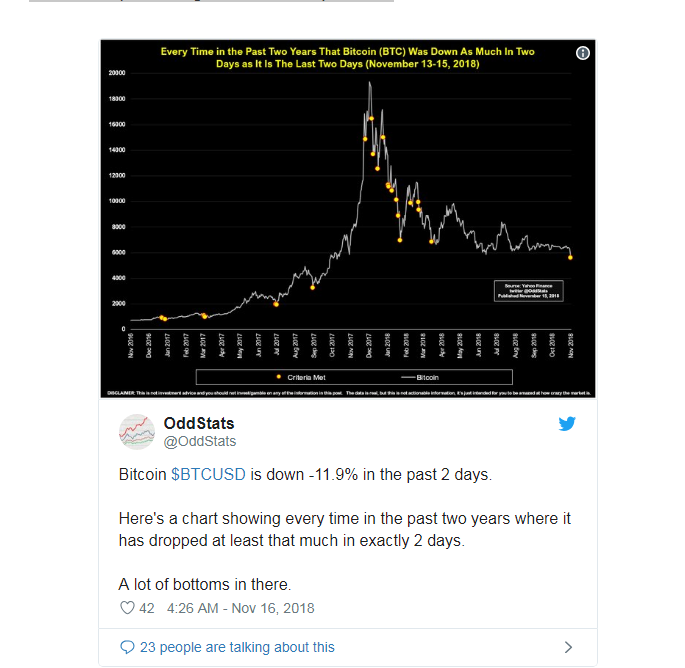
“Bitcoin $BTCUSD is down -11.9% in the past 2 days. Here’s a chart showing every time in the past two years where it has dropped at least that much in exactly 2 days. A lot of bottoms in there,” OddStats wrote.
The last time this occurred was March 29-30, when bitcoin BTCUSD, +0.46% tumbled 13.8% to close at $6,840. Crypto buyers were rewarded with a 46% rally in five weeks as the No. 1 digital currency surged toward $10,000, eventually stalling at $9,990 on May 5.
Before this, the capitulation on Feb. 5-6, which wiped 24.6% off the value of bitcoin, proved once again to be a bargain. Those brave souls booked a whopping 72.1% in just two weeks.
However, perhaps punters are learning. According to data from Bitfinex, the Hong Kong-based cryptocurrency exchange, some investors did, in fact, buy the dip, with the number of long contracts on the exchange climbing from just over 23 thousand to above 27 thousand during the Nov. 13-15 stretch, which is the highest level since Oct. 11.
But, this strategy isn’t for everyone. If you catch the falling knife too soon it can be a costly exercise. Case in point: Using this two-day selloff strategy, a buyer would have bought bitcoin at $16,425 following the Dec. 19-20 decline and then took a 34.8% hit inside 36 hours. Something only true HODLers — those who hold onto bitcoin no matter what is happening — could withstand.